. 2003 Nov 25;100(24):13964-9.
doi: 10.1073/pnas.2336102100. Epub 2003 Nov 11.

Membrane cholesterol, lateral mobility, and the phosphatidylinositol 4,5-bisphosphate-dependent organization of cell actin

Affiliations

Membrane cholesterol, lateral mobility, and the phosphatidylinositol 4,5-bisphosphate-dependent organization of cell actin

Jeanne Kwik et al. Proc Natl Acad Sci U S A. .

Abstract

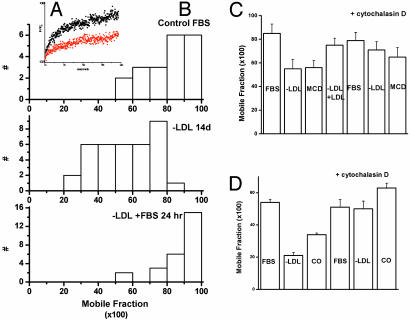
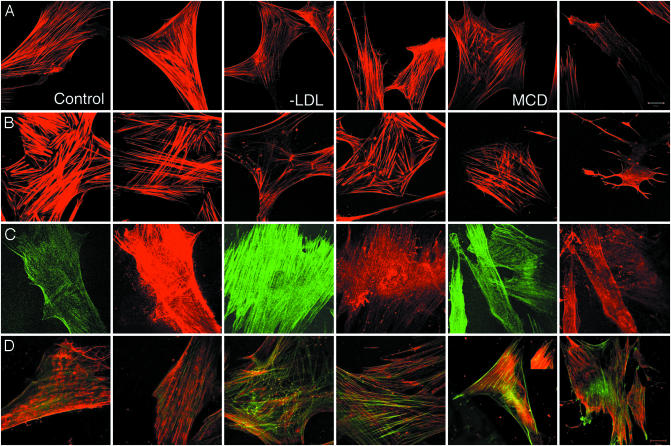
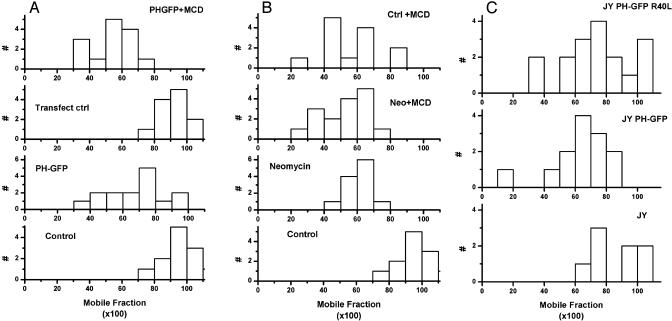
Responses to cholesterol depletion are often taken as evidence of a role for lipid rafts in cell function. Here, we show that depletion of cell cholesterol has global effects on cell and plasma membrane architecture and function. The lateral mobility of membrane proteins is reduced when cell cholesterol is chronically or acutely depleted. The change in mobility is a consequence of the reorganization of the cell actin. Binding of a GFP-tagged pleckstrin homology domain specific for phosphatidylinositol 4,5-bisphosphate [PI(4,5)P2] to the plasma membrane is reduced after cholesterol depletion. This result implies that the reorganization of cytoskeleton depends on the loss or redistribution of plasma membrane PI(4,5)P2. Consistent with this observation, agents that sequester plasma membrane PI(4,5)P2 mimic the effects of cholesterol depletion on actin organization and on lateral mobility.


Figures

Fig. 1.
Fig. 1.
Cholesterol depletion reduces the lateral mobility of HLA molecules of fibroblasts and lymphoblasts. This reduction is reversed by cytochalasin D. (A) Shown is fluorescence recovery after photobleaching of Fab-labeled class I MHC molecules in control 5659c skin fibroblasts (black) and in cells grown in medium lacking LDL (red). Computer fits to these recovery curves estimated maximum recovery as 65–70% for control cells and 30–35% for cells grown without LDL. (B) The mobile fractions of class I HLA molecules on fibroblasts grown in control medium (10% FCS, Top), medium lacking LDL (Middle), or returned to control medium for 24 h after growth for 2 weeks in medium lacking LDL (Bottom). The distribution of mobile fractions is shifted to lower mobility after cholesterol depletion but seems similar to the control when cholesterol-depleted cells are cultured in control medium for 24 h. (C) The average mobile fraction of class I HLA molecules on 5659c skin fibroblasts either grown without LDL for 10–14 days (–LDL) or acutely depleted of cholesterol by treatment with MCD. Mobile fractions are also shown for cells grown in LDL medium reconstituted with purified LDL (–LDL/+LDL) and for cells treated with cytochalasin D (5 μg/ml) for 30 min. (D) The average mobile fraction of class I HLA molecules on JY lymphoblasts either grown without LDL for 10–14 days (–LDL) or acutely depleted of cholesterol by treatment with cholesterol oxidase (0.5 units/ml). Mobile fractions are also shown for cells treated with cytochalasin D (5 μg/ml) for 30 min.
Fig. 2.
Fig. 2.
Laser trapping of HLA molecules labeled with 40-nm beads. (A) HLA I molecules labeled with antibody-coated 40-nm gold beads meet an obstacle as they are dragged along the surface of control fibroblasts. The bead is dragged a little over 1 μm from its initial position, marked by an asterisk (Left). In Center, it meets an obstacle (at a point marked by the arrowhead) and leaves the trap. Half a second later, the bead is still close to the point where it left the trap. (Bar = 2 μm.) (B) HLA I molecules labeled with antibody-coated 40-nm gold beads meet an obstacle as they are dragged along the surface of cholesterol-depleted fibroblasts cultured without LDL for 10–14 days. (Left) Initial position of the bead, marked by an arrow. (Center) Position of the bead when it meets an obstacle. (Right) Shown 0.1 s later, the bead has recoiled in the opposite direction to a point near its starting point.
Fig. 3.
Fig. 3.
Cholesterol depletion and organization of the actin cytoskeleton. (A) From left to right, two examples each of phalloidin labeling of F-actin in control fibroblasts, fibroblasts grown without LDL for 10–14 days, and fibroblast cells incubated with 5 μM MCD for 15 min at 37°C. Labeled stress fibers are more abundant and apparently thicker in control cells than in cholesterol-depleted cells. (B) From left to right, two examples each of phalloidin labeling of F-actin in Triton cytoskeletons prepared from control fibroblasts, fibroblasts grown without LDL for 10–14 days, and fibroblast cells incubated with 10 μM MCD for 30 min at 37°C. Labeled stress fibers are more abundant and apparently thicker in control cells than in cholesterol-depleted cells. Also, radial foci of phalloidin labeling can be seen cholesterol-depleted, but not in control cells. (C) From left to right, incorporation of GFP-actin (green) in, and labeling with anti-gelsolin mAb (red) of Triton cytoskeletons prepared from control fibroblasts, fibroblasts grown without LDL for 10–14 days, and fibroblast cells incubated with 10 μM MCD for 30 min at 37°C. The microscope gain was set as constant for all images. Hence, the dimmer green fluorescence and brighter red fluorescence of control cytoskeletons compared with cytoskeletons from cholesterol-depleted cells indicates that there is lower turnover of stress fibers and a higher level of bound gelsolin in the controls than in the cytoskeletons from cholesterol-depleted cells. (D) From left to right, two examples each of incorporation of GFP-actin (green) in, and labeling with anti-α-actinin mAb (red) of Triton cytoskeletons prepared from control fibroblasts, fibroblasts grown without LDL for 10–14 days, and fibroblast cells incubated with 10 μM MCD for 30 min at 37°C. The microscope gain used to image controls had to be reduced to yield the images of the second, third, fourth, and sixth panels. The Inset of the fifth panel shows a portion of the cell in this panel; imaged with the same gain as controls, it is shown in the fifth panel. (Scale bars = 20 μm.)
Fig. 4.
Fig. 4.
Cholesterol depletion, distribution of PI(4,5)P2 measured in terms of distribution of PH-GFP, and effects of PH-GFP expression on actin cytoskeleton. (A) Confocal microscope sections of cells expressing PH-GFP. Cells were cultured in a Bioptech chamber and imaged in medium at 37°C before cholesterol depletion (Left) and after incubation with 10 mM MCD for 20 min (Right). (B) The distribution of GFP fluorescence across the cells (marked by white lines in A) is shown before cholesterol depletion (Left) and after cholesterol depletion with MCD (Right). It can be seen that the ratio of membrane-bound to cytoplasmic GFP fluorescence shifts to the cytoplasm after cholesterol depletion. (C) Incorporation of GFP-actin by Triton cytoskeletons from cells transfected with a mutant PH domain that does not bind PI(4,5)P2 (Upper) or by cytoskeletons from cells transfected with PH-GFP, which does bind PI(4,5)P2 (Lower). More GFP-actin is incorporated when a PI(4,5)P2-sequestering PH domain is expressed than when the mutant is expressed. (Bar = 20 μm.)
Fig. 5.
Fig. 5.
Effect of sequestering PI(4,5)P2 on lateral mobility of class I HLA molecules. (A) Distribution of lateral mobility of HLA molecules in fibroblasts cultured overnight in neomycin compared with that in control cells or cells acutely depleted of cholesterol with MCD. The distribution of mobile fractions in cells treated with both neomycin and MCD is also shown. (B) Distribution of lateral mobility of HLA molecules in fibroblasts transfected with low levels of PH-GFP compared with that in cells not expressing the PH domain after transfection and to the distribution in PH-GFP-expressing cells also treated with MCD. The mutant GFP-PH domain used as a control for lymphoblasts (5C) could not be used for fibroblasts because it was always expressed at very high levels and its fluorescence bled through into the fluorescence photobleaching and recovery channel of the microscope, creating an artifact of fluorescence recovery. (C) Distribution of lateral mobility of HLA molecules in JY B-lymphoblasts transfected with low levels of PH-GFP compared with the distribution of values in cells expressing a mutant PH domain that does not bind PI(4,5)P2.

References

    1. Edidin, M. (2001) Trends Cell Biol. 11, 492–496. - PubMed
    1. Simons, K. & Toomre, D. (2000) Nat. Rev. Mol. Cell Biol. 1, 31–39. - PubMed
    1. Brown, D. & London, E. (2000) J. Biol. Chem. 275, 17221–17224. - PubMed
    1. Edidin, M. (2003) Annu. Rev. Biophys. Biomol. Struct. 32, 257–283. - PubMed
    1. Xavier, R. Brennan, T, Li, Q., McCormack, C. & Seed, B. (1998) Immunity 8, 723–732. - PubMed

Publication types

MeSH terms