Dissection of K+ currents in Caenorhabditis elegans muscle cells by genetics and RNA interference
- PMID: 14612577
- PMCID: PMC283602
- DOI: 10.1073/pnas.1935976100
Dissection of K+ currents in Caenorhabditis elegans muscle cells by genetics and RNA interference
Abstract
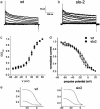
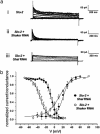
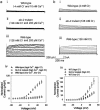
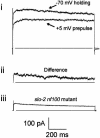
GFP-promoter experiments have previously shown that at least nine genes encoding potassium channel subunits are expressed in Caenorhabditis elegans muscle. By using genetic, RNA interference, and physiological techniques we revealed the molecular identity of the major components of the outward K+ currents in body wall muscle cells in culture. We found that under physiological conditions, outward current is dominated by the products of only two genes, Shaker (Kv1) and Shal (Kv4), both expressing voltage-dependent potassium channels. Other channels may be held in reserve to respond to particular circumstances. Because GFP-promoter experiments indicated that slo-2 expression is prominent, we created a deletion mutant to identify the SLO-2 current in vivo. In both whole-cell and single-channel modes, in vivo SLO-2 channels were active only when intracellular Ca2+ and Cl- were raised above normal physiological conditions, as occurs during hypoxia. Under such conditions, SLO-2 is the largest outward current, contributing up to 87% of the total current. Other channels are present in muscle, but our results suggest that they are unlikely to contribute a large outward component under physiological conditions. However, they, too, may contribute currents conditional on other factors. Hence, the picture that emerges is of a complex membrane with a small number of household conductances functioning under normal circumstances, but with additional conductances that are activated during unusual circumstances.
Figures


Similar articles
-
Genetic dissection of ion currents underlying all-or-none action potentials in C. elegans body-wall muscle cells.J Physiol. 2011 Jan 1;589(Pt 1):101-17. doi: 10.1113/jphysiol.2010.200683. Epub 2010 Nov 8. J Physiol. 2011. PMID: 21059759 Free PMC article.
-
SLO-2 potassium channel is an important regulator of neurotransmitter release in Caenorhabditis elegans.Nat Commun. 2014 Oct 10;5:5155. doi: 10.1038/ncomms6155. Nat Commun. 2014. PMID: 25300429 Free PMC article.
-
KChIP-like auxiliary subunits of Kv4 channels regulate excitability of muscle cells and control male turning behavior during mating in Caenorhabditis elegans.J Neurosci. 2015 Feb 4;35(5):1880-91. doi: 10.1523/JNEUROSCI.3429-14.2015. J Neurosci. 2015. PMID: 25653349 Free PMC article.
-
Worms take to the slo lane: a perspective on the mode of action of emodepside.Invert Neurosci. 2012 Jun;12(1):29-36. doi: 10.1007/s10158-012-0133-x. Epub 2012 Apr 27. Invert Neurosci. 2012. PMID: 22539031 Free PMC article. Review.
-
Structure and function of Kv4-family transient potassium channels.Physiol Rev. 2004 Jul;84(3):803-33. doi: 10.1152/physrev.00039.2003. Physiol Rev. 2004. PMID: 15269337 Review.
Cited by
-
CLHM-1 is a functionally conserved and conditionally toxic Ca2+-permeable ion channel in Caenorhabditis elegans.J Neurosci. 2013 Jul 24;33(30):12275-86. doi: 10.1523/JNEUROSCI.5919-12.2013. J Neurosci. 2013. PMID: 23884934 Free PMC article.
-
Cell excitability necessary for male mating behavior in Caenorhabditis elegans is coordinated by interactions between big current and ether-a-go-go family K(+) channels.Genetics. 2012 Mar;190(3):1025-41. doi: 10.1534/genetics.111.137455. Epub 2011 Dec 14. Genetics. 2012. PMID: 22174070 Free PMC article.
-
Shank promotes action potential repolarization by recruiting BK channels to calcium microdomains.Elife. 2022 Mar 10;11:e75140. doi: 10.7554/eLife.75140. Elife. 2022. PMID: 35266450 Free PMC article.
-
Mutant analysis of the Shal (Kv4) voltage-gated fast transient K+ channel in Caenorhabditis elegans.J Biol Chem. 2006 Oct 13;281(41):30725-35. doi: 10.1074/jbc.M605814200. Epub 2006 Aug 9. J Biol Chem. 2006. PMID: 16899454 Free PMC article.
-
Action potentials drive body wall muscle contractions in Caenorhabditis elegans.Proc Natl Acad Sci U S A. 2011 Feb 8;108(6):2557-62. doi: 10.1073/pnas.1012346108. Epub 2011 Jan 19. Proc Natl Acad Sci U S A. 2011. PMID: 21248227 Free PMC article.
References
-
- Christensen, M., Estevez, A., Yin, X., Fox, R., Morrison, R., McDonnell, M., Gleason, C., Miller, D. M., 3rd & Strange, K. (2002) Neuron 33, 503-514. - PubMed
-
- Wang, Z. W., Saifee, O., Nonet, M. L. & Salkoff, L. (2001) Neuron 32, 867-881. - PubMed
-
- Salkoff, L., Butler, A., Fawcett, G., Kunkel, M., McArdle, C., Paz-y-Mino, G., Nonet, M., Walton, N., Wang, Z. W., Yuan, A. & Wei, A. (2001) Neuroscience 103, 853-859. - PubMed
-
- Bargmann, C. I. (1998) Science 282, 2028-2033. - PubMed
Publication types
MeSH terms
Substances
Grants and funding
LinkOut - more resources
Full Text Sources
Miscellaneous

