. 2003 Nov 25;100(24):14151-6.
doi: 10.1073/pnas.1835830100. Epub 2003 Nov 11.

The mature activating natural killer cell immunologic synapse is formed in distinct stages

Affiliations

The mature activating natural killer cell immunologic synapse is formed in distinct stages

Jordan S Orange et al. Proc Natl Acad Sci U S A. .

Abstract

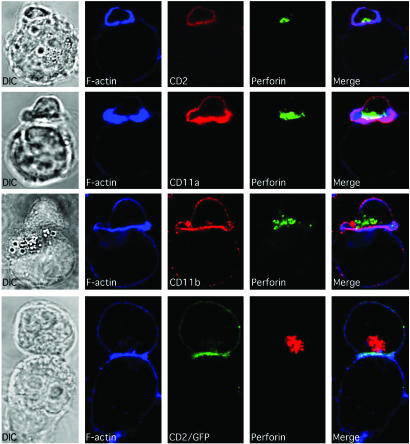
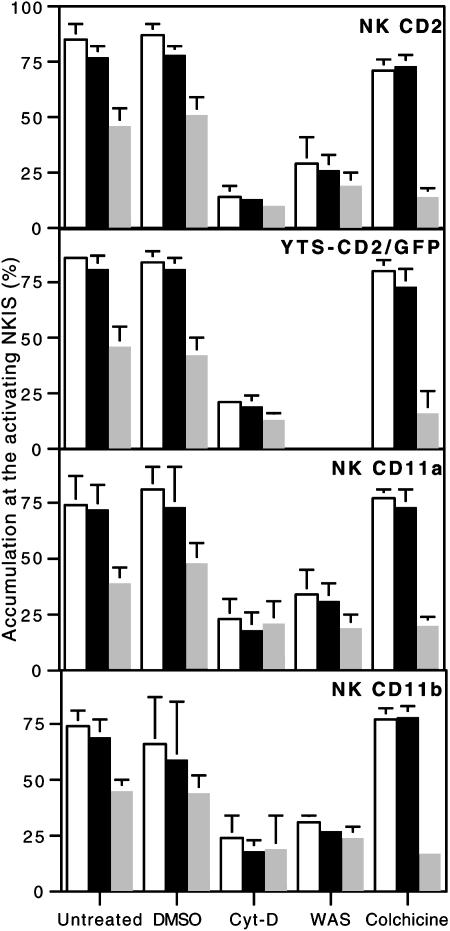
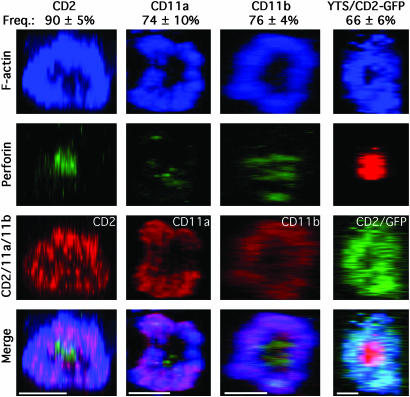
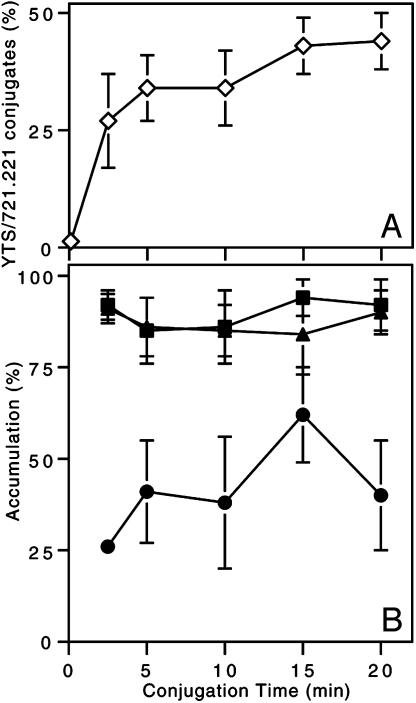
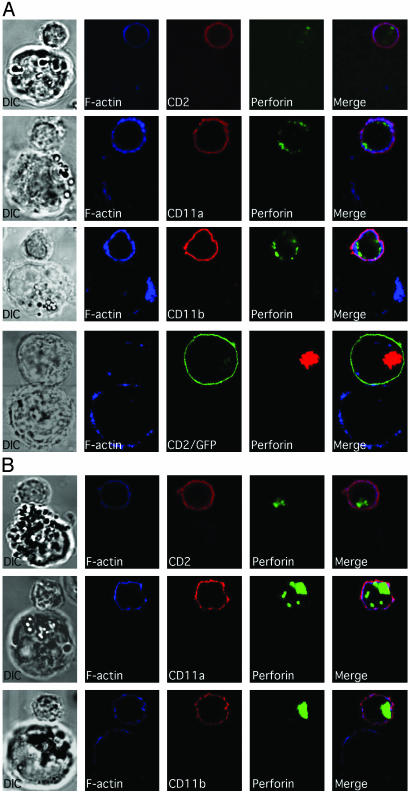
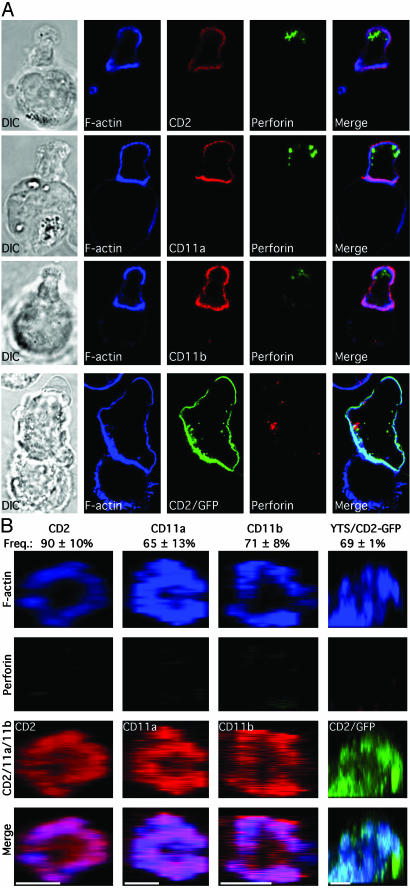
Natural killer (NK) cells form a structure at their interface with a susceptible target cell called the activating NK cell immunologic synapse (NKIS). The mature activating NKIS contains a central and peripheral supramolecular activation cluster (SMAC), and includes polarized surface receptors, filamentous actin (F-actin) and perforin. Evaluation of the NKIS in human NK cells revealed CD2, CD11a, CD11b and F-actin in the peripheral SMAC (pSMAC) with perforin in the central SMAC. The accumulation of F-actin and surface receptors was rapid and depended on Wiskott-Aldrich syndrome protein-driven actin polymerization. The accumulation at and arrangement of these molecules in the pSMAC was not affected by microtubule depolymerization. The polarization of perforin, however was slower and required intact actin, Wiskott-Aldrich syndrome protein, and microtubule function. Thus the process of CD2, CD11a, CD11b, and F-actin accumulation in the pSMAC and perforin accumulation in the central SMAC of the NKIS are sequential processes with distinct cytoskeletal requirements.


Figures

Fig. 1.
Fig. 1.
F-actin, along with CD2, CD11a, CD11b, and perforin, all polarize to the mature lytic NKIS. Ex vivo NK cells (small cells) are shown conjugated with K562 cells (large cells) in the top three rows, and a YTS-CD2/GFP cell (top cell) with a 721.221 cell (bottom cell) in the bottom row. Differential interference contrast images are in the left column and fluorescent images are in the right columns. F-actin is in the second column (blue). CD2, CD11a, or CD11b (red) and CD2/GFP (green) are in the third column. Perforin (green) in ex vivo NK cells and in YTS-CD2/GFP cells (red) is in the fourth column. A merged overlay of all fluorescent channels is in the fifth column.
Fig. 6.
Fig. 6.
Cumulative summary of molecular polarization to the activating NKIS. Accumulation of F-actin (white bars), CD2, CD2/GFP, CD11a, or CD11b and perforin (gray bars) at the activating NKIS in ex vivo NK cells conjugated with K562 cells, or in YTS-CD2/GFP cells conjugated with 721.221 cells are shown. Cells were untreated, DMSO-treated, Cyt-D-treated, from a WAS patient, or colchicine-treated, as displayed on the x axis. Each cluster of bars represents the mean ± SD of three to six independent experiments, and the entire figure summarizes ≈4,000 individual conjugates. In all untreated samples, perforin was polarized less frequently than F-actin or the respective cell-surface receptor (P < 0.005). All molecular accumulations in Cyt-D-treated or WAS NK cells were less frequent than those found in their respective controls (P < 0.005), whereas in colchicine-treated cells only perforin polarization was decreased (P < 0.005).
Fig. 2.
Fig. 2.
F-actin with CD2, CD11a, or CD11b accumulate in the pSMAC and perforin in the cSMAC of the mature lytic NKIS. Representative lytic synapses were evaluated throughout their volume, and the z, x plane was reconstructed. The first three columns show lytic synapses in ex vivo NK cells conjugated with K562 cells. F-actin (blue, top row), perforin (green, second row), or CD2 in the first column, CD11a in the second column, or CD11b in the third column (red, third row) are shown. A synapse between a YTS-CD2/GFP cell and 721.221 cell is in the fourth column with F-actin (blue), perforin (red), and CD2/GFP (green) being shown. A merged overlay of all fluorescent channels is shown in the bottom row. (Scale bars, 5 μm). The mean frequency of synapses with an F-actin and CD2, CD11a, or CD11b in the pSMAC and perforin in the cSMAC are above the representative images (n = 3–5 experiments/donors ± SD).
Fig. 3.
Fig. 3.
CD2 and F-actin accumulate at the activating NKIS more readily than does perforin. (A) Conjugation of YTS-CD2/GFP cells with 721.221 over time (⋄) was calculated as a percentage of total YTS-CD2/GFP cells present. (B) The accumulation of F-actin (▴), CD2/GFP (▪), and perforin (•) at the IS of YTS-CD2/GFP cells conjugated with 721.221 cells was evaluated for each time point (except time 0 due to the insignificant number of conjugates found). Individual points are the mean of four to eight experiments ± SD.
Fig. 4.
Fig. 4.
Polarization of cell-surface receptors and perforin to the activating NKIS depends on the actin cytoskeleton and WASp function. (A) Ex vivo NK cells treated with Cyt-D are shown conjugated to K562 cells (top three rows) and similarly treated YTS-CD2/GFP cells conjugated to 721.221 cells (bottom row). DMSO was used as a diluent for Cyt-D stocks, and this vehicle alone did not affect molecular polarizations (see Fig. 6). (B) Ex vivo NK cells from a patient with WAS are shown conjugated with K562 cells. The colors, specific molecules evaluated, and figure layout are the same as in Fig. 1.
Fig. 5.
Fig. 5.
Perforin, but not cell-surface receptor or F-actin accumulation at the activating NKIS, depends on microtubule function. (A) Ex vivo NK cells or YTS-CD2/GFP cells treated with colchicine were conjugated with K562 or 721.221 cells, respectively. Layout, specific molecules evaluated, and colors displayed are the same as for Fig. 1. (B) Synapses from colchicine-treated ex vivo NK or YTS-CD2/GFP were analyzed throughout their volume and reconstructed in the z, x plane. The colors, specific molecules evaluated, and layout are the same as in Fig. 2. (Scale bars, 5 μm).

References

    1. Orange, J. S. (2002) Microbes Infect. 4, 1545–1558. - PubMed
    1. Miller, J. S. (2002) Cancer Invest. 20, 405–419. - PubMed
    1. Kohl, S., Springer, T. A., Schmalstieg, F. C., Loo, L. S. & Anderson, D. C. (1984) J. Immunol. 133, 2972–2978. - PubMed
    1. Bolhuis, R. L., Roozemond, R. C. & van de Griend, R. J. (1986) J. Immunol. 136, 3939–3944. - PubMed
    1. Inoue, H., Miyaji, M., Kosugi, A., Nagafuku, M., Okazaki, T., Mimori, T., Amakawa, R., Fukuhara, S., Domae, N., Bloom, E. T. & Umehara, H. (2002) Eur. J. Immunol. 32, 2188–2198. - PubMed

Publication types