

Differential expression profiling of head and neck squamous cell carcinoma (HNSCC)
- PMID: 14612907
- PMCID: PMC2394447
- DOI: 10.1038/sj.bjc.6601373
Differential expression profiling of head and neck squamous cell carcinoma (HNSCC)
Abstract
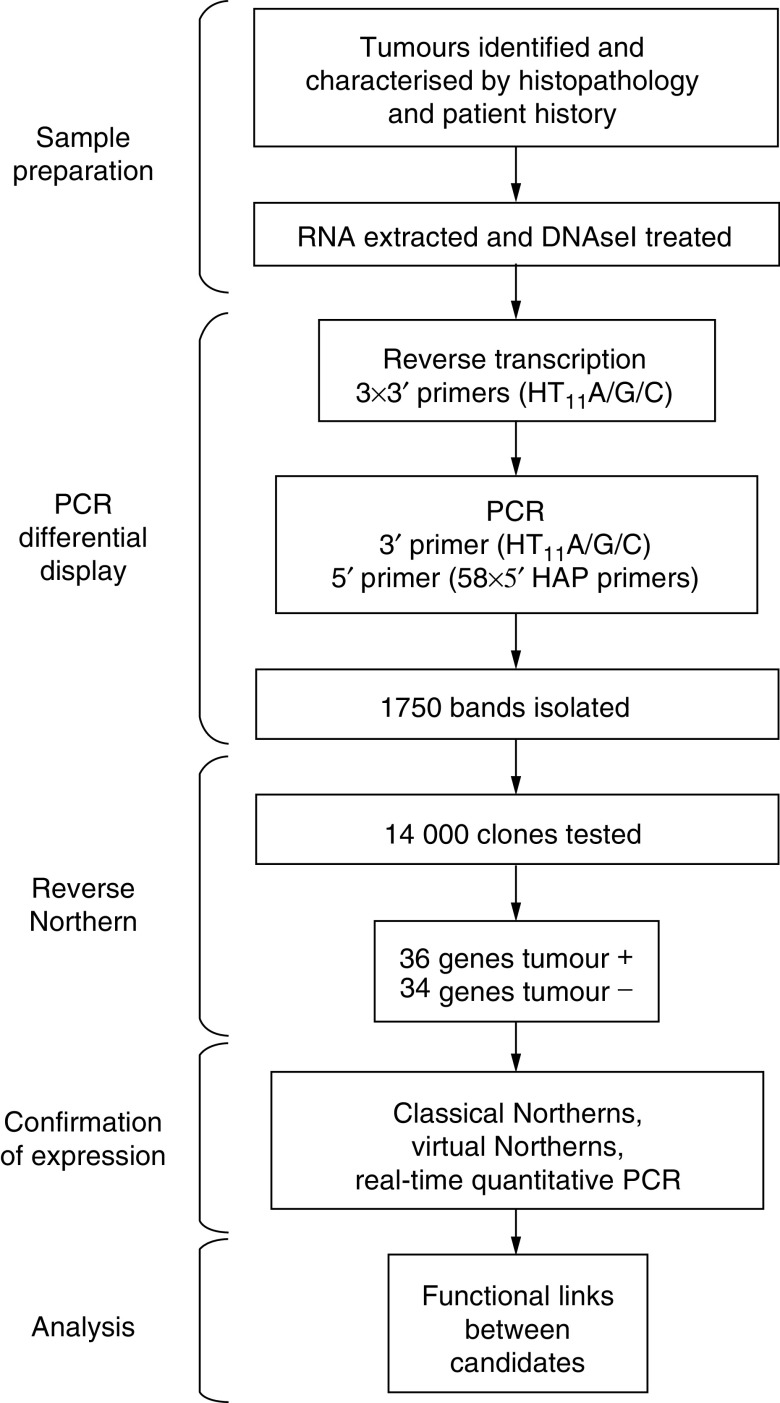
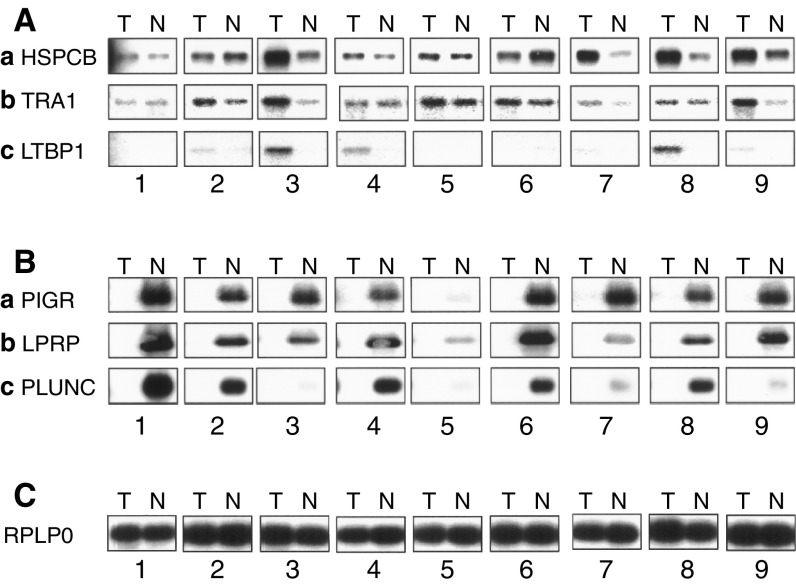
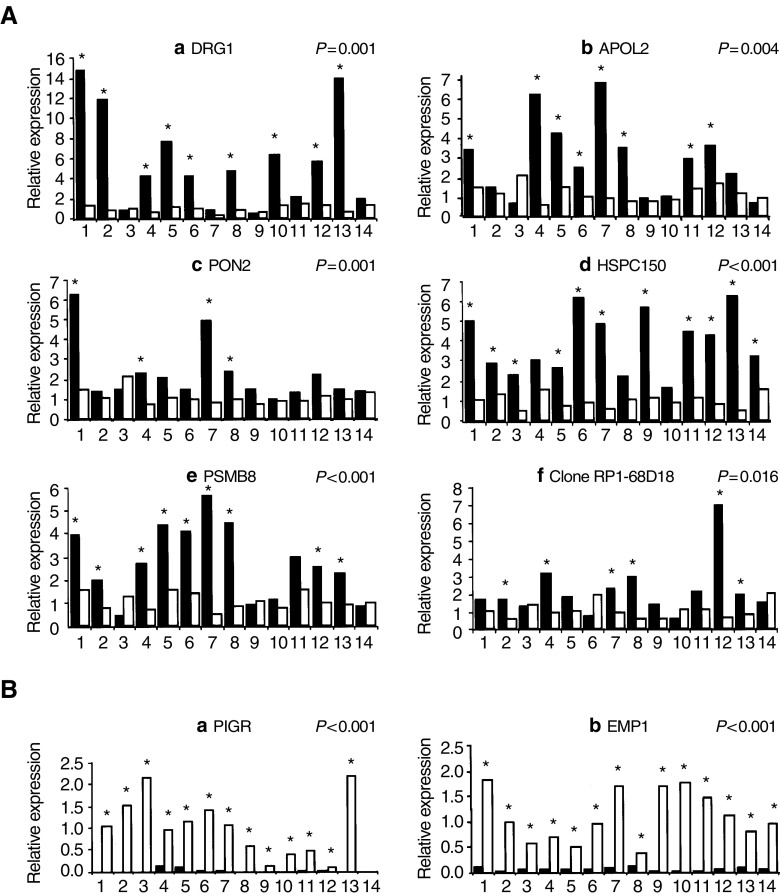
Head and neck squamous cell carcinoma (HNSCC) is the fifth most common cancer in men with an incidence of about 780000 new cases per year worldwide and a poor rate of survival. There is a need for a better understanding of HNSCC, for the development of rational targeted interventions and to define new prognostic or diagnostic markers. To address these needs, we performed a large-scale differential display comparison of hypopharyngeal HNSCCs against histologically normal tissue from the same patients. We have identified 70 genes that exhibit a striking difference in expression between tumours and normal tissues. There is only a limited overlap with other HNSCC gene expression studies that have used other techniques and more heterogeneous tumour samples. Our results provide new insights into the understanding of HNSCC. At the genome level, a series of differentially expressed genes cluster at 12p12-13 and 1q21, two hotspots of genome disruption. The known genes share functional relationships in keratinocyte differentiation, angiogenesis, immunology, detoxification, and cell surface receptors. Of particular interest are the 13 'unknown' genes that exist only in EST, theoretical cDNA and protein databases, or as chromosomal locations. The differentially expressed genes that we have identified are potential new markers and therapeutic targets.
Figures
References
-
- Agarwala KL, Kokame K, Kato H, Miyata T (2000) Phosphorylation of RTP, an ER stress-responsive cytoplasmic protein. Biochem Biophys Res Commun 272: 641–647 - PubMed
-
- Ahmed N, Pansino F, Clyde R, Murthi P, Quinn MA, Rice GE, Agrez MV, Mok S, Baker MS (2002) Overexpression of alpha(v)beta6 integrin in serous epithelial ovarian cancer regulates extracellular matrix degradation via the plasminogen activation cascade. Carcinogenesis 23: 237–244 - PubMed
-
- Al Moustafa AE, Alaoui-Jamali MA, Batist G, Hernandez-Perez M, Serruya C, Alpert L, Black MJ, Sladek R, Foulkes WD (2002) Identification of genes associated with head and neck carcinogenesis by cDNA microarray comparison between matched primary normal epithelial and squamous carcinoma cells. Oncogene 21: 2634–2640 - PubMed
-
- Alevizos I, Mahadevappa M, Zhang X, Ohyama H, Kohno Y, Posner M, Gallagher GT, Varvares M, Cohen D, Kim D, Kent R, Donoff RB, Todd R, Yung CM, Warrington JA, Wong DT (2001) Oral cancer in vivo gene expression profiling assisted by laser capture microdissection and microarray analysis. Oncogene 20: 6196–6204 - PubMed
-
- Bar-Eli M (1999) Role of interleukin-8 in tumor growth and metastasis of human melanoma. Pathobiology 67: 12–18 - PubMed
Publication types
MeSH terms
Substances
LinkOut - more resources
Full Text Sources
Medical
Research Materials
