. 2003 Nov 12;23(32):10249-57.
doi: 10.1523/JNEUROSCI.23-32-10249.2003.

Surround antagonism in macaque cone photoreceptors

Affiliations

Surround antagonism in macaque cone photoreceptors

Jan Verweij et al. J Neurosci. .

Abstract

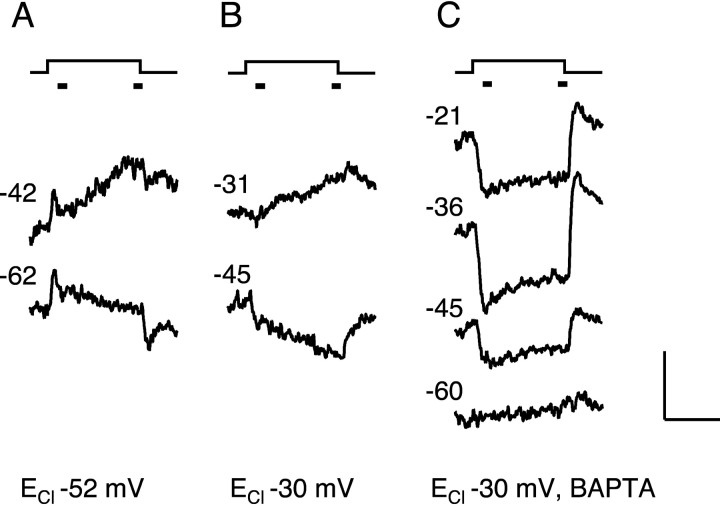
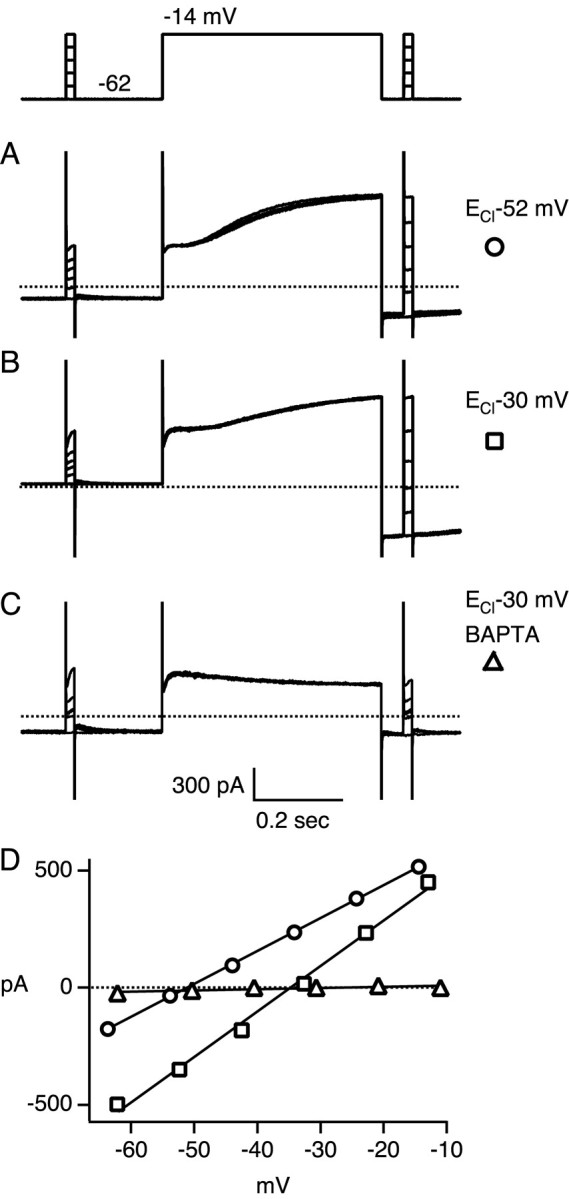
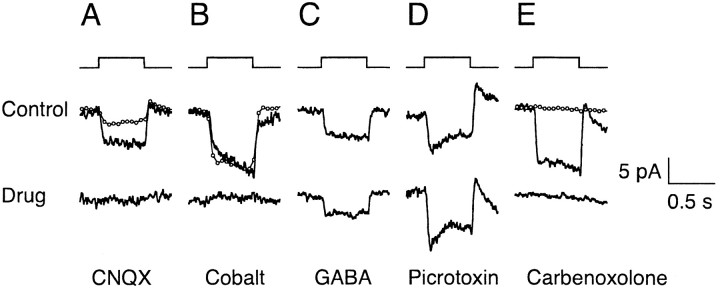
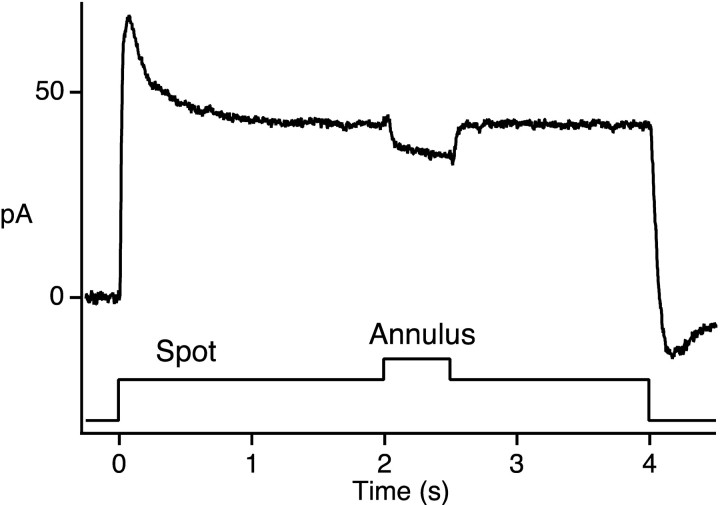
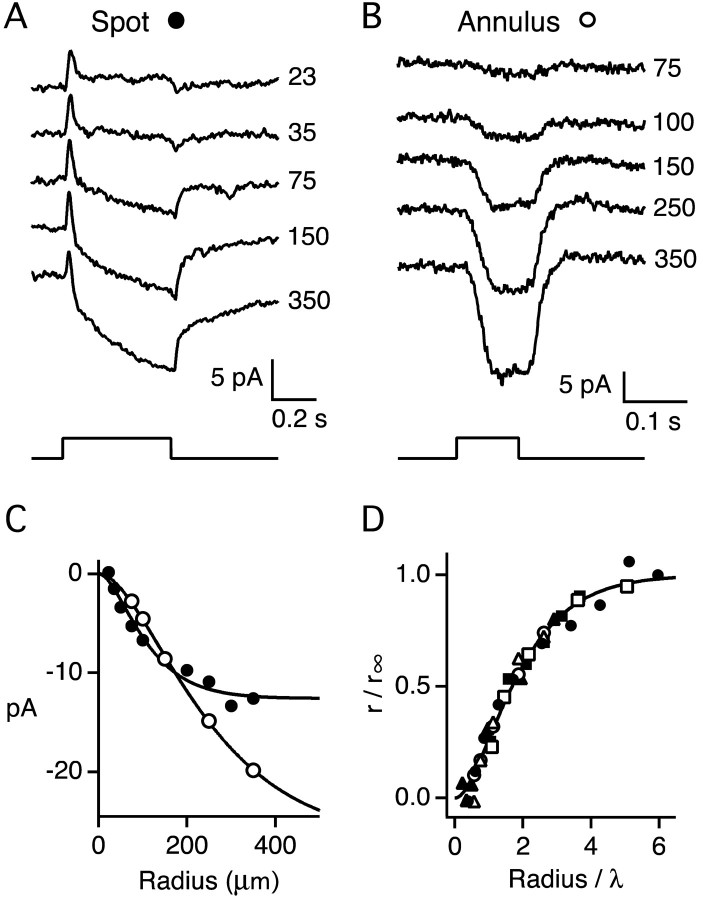
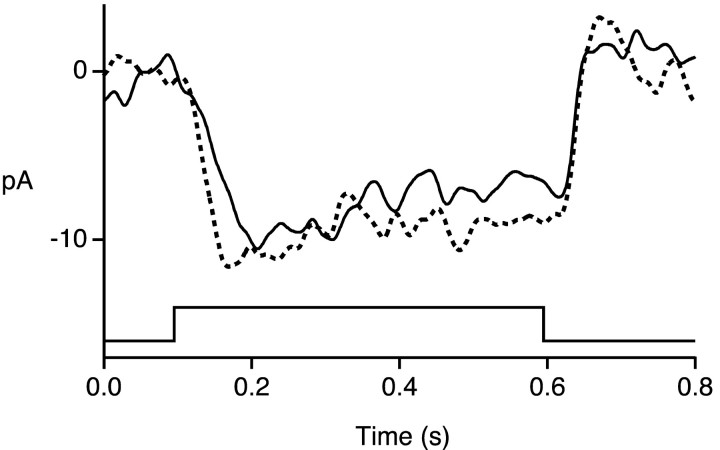
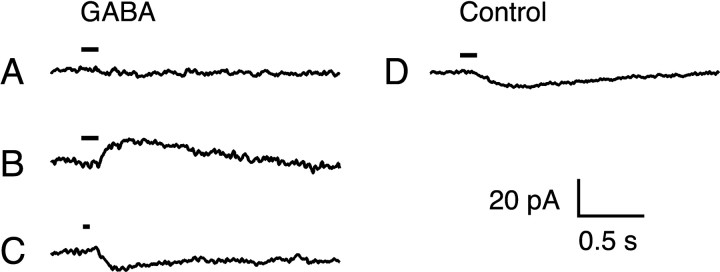
Center-surround antagonism is a hallmark feature of the receptive fields of sensory neurons. In retinas of lower vertebrates, surround antagonism derives in part from inhibition of cone photoreceptors by horizontal cells. Using whole-cell patch recording methods, we found that light-evoked responses of cones in macaque monkey were antagonized when surrounding cones were illuminated. The spatial and spectral properties of this antagonism indicate that it results from inhibition by horizontal cells. It has been suggested that horizontal cell inhibition is mediated by the neurotransmitter GABA. The inhibition observed here, however, was inconsistent with a GABA-gated chloride conductance mechanism. Instead, surround illumination evoked an increase in calcium conductance and calcium-activated chloride conductance in cones. We expect that these conductances modulate neurotransmitter release at the cone synapse and increase visual sensitivity to spatial contrast.


Figures

Figure 6.
Figure 6.
Dependence of surround response on chloride, calcium, and membrane potential. Change in membrane current in response to annulus in three cones. Traces are averages of one or two responses. The holding potential is indicated by the numbers (in millivolts) to the left of each trace. Bandwidth DC-50 Hz. The cone in A was recorded with patch solution 1 (ECl -52 mV), the cone in B with patch solution 2 (ECl -30 mV), and the cone in C with patch solution 3 (ECl -30 mV, 5 mm BAPTA). Annulus monitor is shown above current traces. The bars near the annulus monitors indicate the time windows used for measuring response amplitude. The horizontal calibration bar is 300 msec. The vertical bar is 9 pA in A, 6 pA in B, and 18 pA in C. The annulus (500 nm, 1.1 × 10⁶ photons μm-2 sec-1) had an inner radius of 40 μm and an outer radius of 250-350 μm. An adapting spot of light (radius 35 μm, 500 nm, 5.6 × 10⁶ photons μm-2 sec-1) was present continuously.
Figure 7.
Figure 7.
Voltage dependence of the calcium-activated chloride current. A-C, Depolarization from -62 to -14 mV for 500 msec evoked an inward tail current after repolarization of the membrane potential. The voltage dependence of the tail current was measured with 20 msec pulses to potentials between approximately -62 and -14 mV in steps of ∼10 mV, before and after the 500 msec depolarizing step. The voltage protocol is given by the top trace, and membrane currents measured in three cones are plotted below. Dotted lines denote zero membrane current. Traces are averages of one or two responses. Bandwidth DC-2 kHz. Patch solution 1 (ECl -52 mV) was used in A, patch solution 2 (ECl -30 mV) in B, and patch solution 3 (ECl -30 mV, 5 mm BAPTA) in C. D, The instantaneous current-voltage relationship of the tail current was calculated by averaging the amplitude of the membrane current averaged between 2 and 5 msec after onset of the 20 msec voltage pulse. The symbols plot the amplitudes measured during the tail current minus the amplitudes measured before the 500 msec depolarization for the cells illustrated in A (○), B (□), and C (Δ). The straight lines are least square fits to the data points. The slope conductances and reversal potentials calculated after correction for series resistance errors were (in nanosiemens and millivolts): 22, -53 (○); 29, -38 (□); 0.3, -9 (Δ).
Figure 4.
Figure 4.
Pharmacological blockade of surround response. Change in membrane current in response to annulus flash. The annulus response was blocked by bath application of the glutamate receptor antagonist CNQX (A), by synaptic blocker cobalt chloride (B), and by gap junction blocker carbenoxolone (E), but not by GABA (C), or GABA-receptor antagonist picrotoxin (D). Responses during drug application were measured from 3 to 12 min after drug onset. Circles plot the responses obtained after return to the control solution. Responses in A and B, measured 15 and 5 min, respectively, after return to control, showed partial or complete recovery. No recovery was seen in E for responses measured 8 min after return to control. Current traces are averages of 3-12 responses. Holding potential, -35 to -47 mV. Bandwidth DC-50 Hz. For cells in A and B, patch solution 1 was used with perforated patch recording. Patch solution 4 and whole-cell recordings were used for the cells in C-E. Annulus flash monitor is shown above current traces. Annulus responses were measured in the presence of a bright-adapting spot of radius 20-35 μm. Annuli had inner radii of 20-40 μm and outer radii of 205-350 μm. Drug concentrations were as follows: 20 μm CNQX (A), 100 μm CoCl2 (B), 500 μm GABA plus 25 μm GABA uptake inhibitor SKF89976A (C), 200 μm picrotoxin (D), and 100 μm carbenoxolone (E).
Figure 1.
Figure 1.
Antagonistic surround response of a cone in primate retina. Change in membrane current of a cone in response to a spot and annulus plotted as a function of time. Stimulus monitor shown below current trace. The current trace is the average of six responses. Perforated patch recording with patch solution 1. Holding potential, -47 mV. Bandwidth DC-250 Hz. Spot stimulus, 20 μm radius; 500 nm; 5.2 × 10⁶ photons μm-2 sec-1. Annulus, 20 μm inside radius; 205 μm outside radius; 500 nm; 1.3 × 10⁶ photons μm-2 sec-1.
Figure 2.
Figure 2.
Amplitude of cone surround response as a function of stimulus radius. A, Membrane current of a cone in response to spots of increasing radius. Spot radius is indicated by the numbers next to each trace (in micrometers). Traces are averages of three responses and are displaced vertically for clarity. Stimulus monitor is shown below current traces. Stimulus wavelength, 530 nm; stimulus intensity, 1.56 × 10⁶ photons μm-2 sec-1. Holding potential, -40 mV. Bandwidth DC-250 Hz. Patch solution 4. B, Membrane current of a different cone in response to annuli of increasing outer radii. Annulus inner radius is 40 μm. The outer radius is given by the numbers next to each trace (in micrometers). Traces are averages of two responses and are displaced vertically for clarity. Holding potential, -46 mV. Bandwidth DC-250 Hz. Stimulus monitor is shown below current traces. An adapting spot of radius 35 μm was turned on 1 sec before annulus onset. Stimulus wavelength and intensity were 500 nm, 5.6 × 10⁶ photons μm-2 sec-1 (spot), and 500 nm, 1.1 × 10⁶ photons photons μm-2 sec-1 (annulus). Patch solution 3. C, Response amplitudes from A (•), and B (○) plotted as a function of stimulus outer radius. Response amplitudes were averaged over the time window 480-500 msec after spot onset in A and 80-100 msec after annulus onset in B. The continuous curves are Equation 1 with r = 12.6 pA and λ = 59 μm for the filled symbols, and r = 26.8 pA and λ = 134 μm for the open symbols. The data are shifted vertically by -0.8 pA (•) and -1.0 pA (○) as indicated in Materials and Methods. D, Response amplitude plotted as a function of stimulus radius on normalized axes. The filled symbols were obtained from three cones in response to spot stimuli, the open symbols from three cones in response to annuli. The continuous curve is Equation 1. The constants r and λ were determined for each cell by least squares fit. The best fitting values for r (in picoamperes) and λ (in micrometers) were, respectively: 26.8, 134 (○); 22.1, 129 (Δ); 5.0, 69 (□); 12.6, 59 (•); 21.3, 103 (▴); 30.4, 95 (▪).
Figure 3.
Figure 3.
Antagonistic surround has mixed cone input. Change in membrane current in response to annuli of 500 nm (solid curve) and 660 nm (dotted curve). Curves are averages of five responses. Holding potential, -37 mV. Bandwidth DC-20 Hz. Patch solution 4. Annulus inner and outer radius were 60 and 350 μm, respectively. Stimulus intensity was 2.9 × 10⁴ photons μm-2 sec-1 (500 nm) and 1.2 × 10⁶ photons μm-2 sec-1 (660 nm). Intensities were in the linear portion of the response range of the cone. A dim uniform background (500 nm, 860 photons μm-2 sec-1) was presented continuously to minimize effects of rod input. An adapting spot (530 nm, 6.0 × 10⁶ photons μm-2 sec-1, radius 35 μm) was also presented continuously.
Figure 5.
Figure 5.
Test of GABA sensitivity. Change in membrane current in response to pressure ejection of 1 mm GABA (A-C) and control Lockes solution (D). Timing of the ejection is indicated by the bars above the current traces. Each trace is from a different cone and is the average of one or two responses. GABA sensitivity was tested in 12 cones. GABA evoked no detectable responses in seven cones (A), outward currents in one cone (B), and inward currents in four cones (C) at a holding potential of -62 mV. Chloride equilibrium potential, -30 mV. Bandwidth DC-30 Hz. Patch solution 3 was used in A and B, and solution 2 in C and D.

References

    1. Ahnelt P, Kolb HJ ( 1994) Horizontal cells and cone photoreceptors in primate retina: a Golgi-light microscopic study of spectral connectivity. Comp Neurol 15: 387-405. - PubMed
    1. Baylor DA, Fuortes MGF, O'Bryan PM ( 1971) Receptive fields of cones in the retina of the turtle. J Physiol (Lond) 214: 265-294. - PMC - PubMed
    1. Baylor DA, Nunn BJ, Schnapf JL ( 1987) Spectral sensitivity of cones of the monkey Macaca fascicularis J Physiol (Lond) 390: 145-160. - PMC - PubMed
    1. Bloomfield SA, Xin D ( 2000) Surround inhibition of mammalian AII amacrine cells is generated in the proximal retina. J Physiol (Lond) 523: 771-783. - PMC - PubMed
    1. Budde T, Meuth S, Pape H-C ( 2002) Calcium-dependent inactivation of neuronal calcium channels. Nat Rev Neurosci 3: 873-883. - PubMed

Publication types

MeSH terms

LinkOut - more resources