. 2003 Nov 12;23(32):10411-8.
doi: 10.1523/JNEUROSCI.23-32-10411.2003.

Electrophysiological differentiation of new neurons in the olfactory bulb

Affiliations

Electrophysiological differentiation of new neurons in the olfactory bulb

Ottorino Belluzzi et al. J Neurosci. .

Abstract

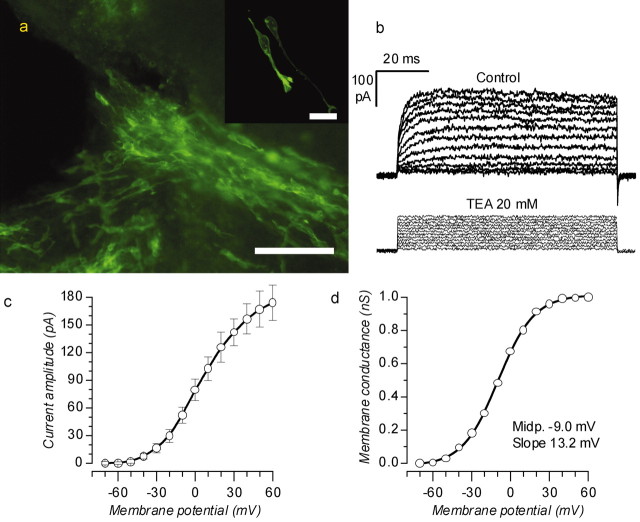
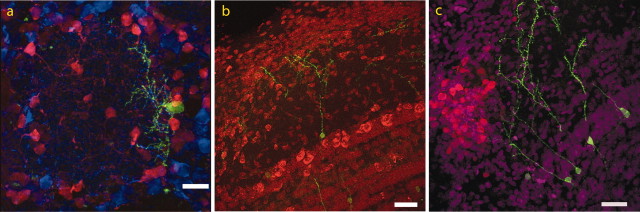
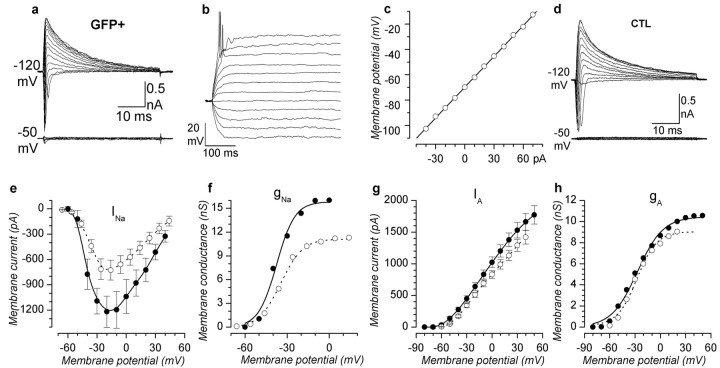
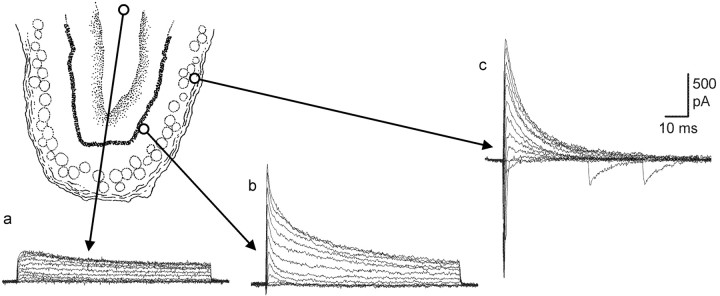
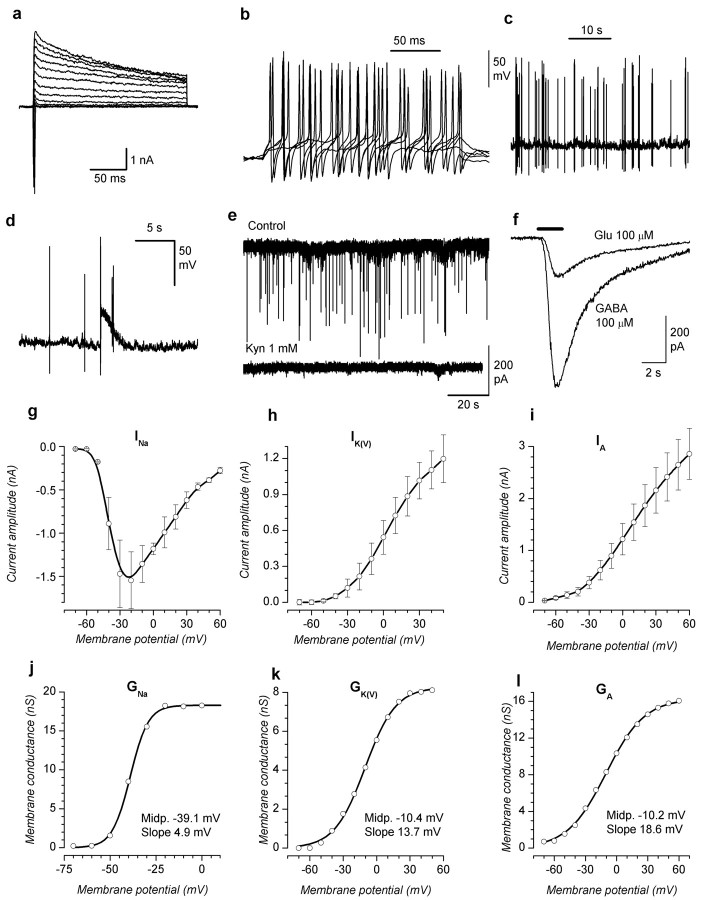
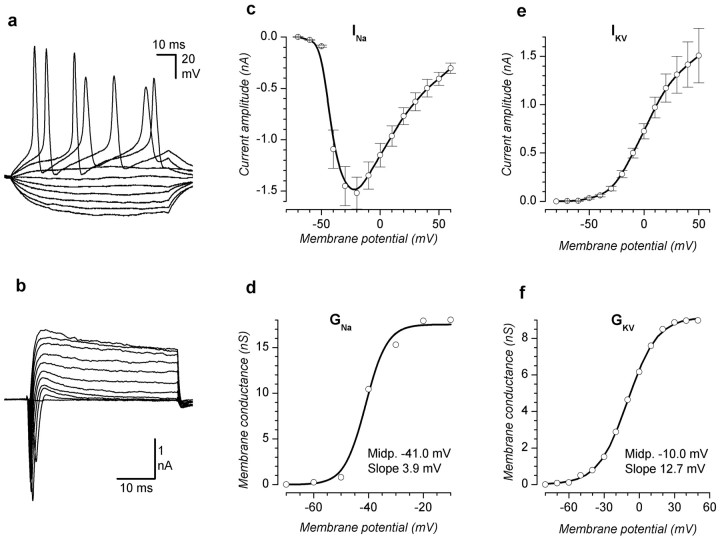
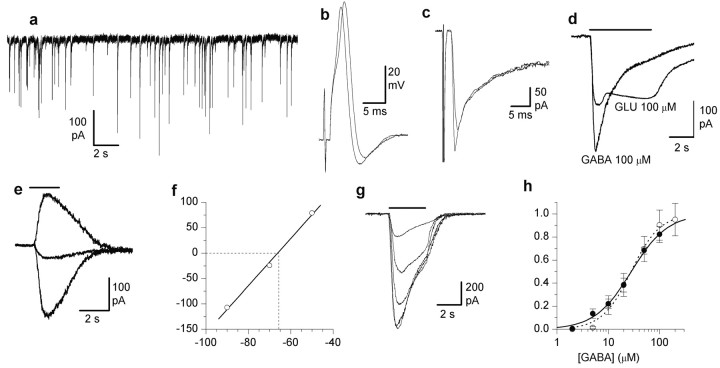
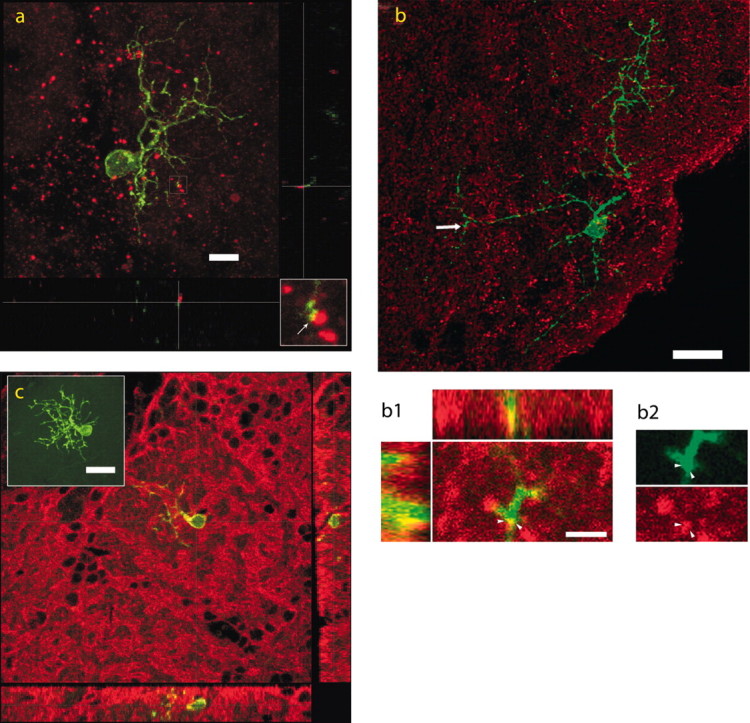
The subventricular zone produces neuroblasts that migrate to the olfactory bulb (OB) and differentiate into interneurons throughout postnatal life (Altman and Das, 1966; Hinds, 1968; Altman, 1969; Kishi et al., 1990; Luskin, 1993; Lois and Alvarez-Buylla, 1994). Although such postnatally generated interneurons have been characterized morphologically, their physiological differentiation has not been thoroughly described. Combining retroviral-mediated labeling of newly generated neurons with patch-clamp electrophysiology, we demonstrated that soon after new cells enter the layers of the olfactory bulb, they display voltage-dependent currents typical of more mature neurons. We also show that these "newcomers" express functional GABA and glutamate receptor channels, respond synaptically to stimulation of the olfactory nerve, and may establish both axodendritic and dendrodendritic synaptic contacts within the olfactory bulb. These data provide a basic description of the physiology of newly generated cells in the OB and show that such new cells are functional neurons that synaptically integrate into olfactory bulb circuitry soon after their arrival.


Figures

Figure 1.
Figure 1.
Morphological and electrophysiological properties of migrating neuroblasts along the RMS. a, SVZa from a rat at P89, 5 d after virus injection (rostral is to the right). Scale bar, 100 μm. The inset is a confocal image of migrating neuroblasts in the initial portion of the RMS. Scale bar, 16 μm. b, Voltage-clamp recordings from a cell in the RMS. The cell was held at -70 mV and depolarized to potentials ranging from -60 to 60 mV in normal ACSF (top) and after the addition of the potassium channel blocker TEA (20 mm). c, d, Current-voltage (c) and conductance-voltage (d) relationships of the delayed-rectifier K+ current in migrating neuroblasts (n = 14). The voltage dependencies of gK were described by Boltzmann equations with a midpoint and slope of -8.9 and 13.2 mV and a maximal conductance of 1.0 nS.
Figure 2.
Figure 2.
Newly generated cells in different layers of the olfactory bulb. a, A newborn eGFP+ PG cell (green) around a glomerulus at P109, 3 weeks after virus injection. Calretinin-labeled (red) and tyrosine hydroxylase-labeled (blue) PG cells outline the glomerulus. Scale bar, 20 μm. b, GFP+ granule cell in the mitral cell layer (red, Nissl staining; P52, 37 d survival). Scale bar, 40 μm. c, GFP+ cells in the granule cell layer (red, TH; magenta, TOPRO3; P52, 37 d survival). Scale bar, 40 μm.
Figure 3.
Figure 3.
Properties of newborn PG cells compared with those of older neurons of the same type. a, Families of whole-cell currents in response to voltage steps from -50 to 80 mV after 250 msec preconditioning at -120 mV (top) and -50 mV (bottom) (P28, 13 d after virus injection). b, Voltage responses to injected currents (from -40 to 70 pA in steps of 10 pA) from a potential of -70 mV. c, Membrane potential as a function of injected current; average potential during the last 100 msec of the depolarizing pulse. a-c, GFP+ PG cell. d, Families of whole-cell currents in control PG cells in response to the same protocols as in a. e, f, I-V and conductance-voltage relationships of sodium current (○, controls; •, GFP+ cells). Maximal values of gNa were 11.13 nS in controls and 15.85 nS in GFP+ PG cells. The voltage dependencies of gNa were described by Boltzmann equations with midpoints and slopes of -34.4 and 6.76 mV for controls and -37.5 and 6.48 mV for GFP+ PG cells. g, h, I-V and conductance-voltage relationships of A current (○, controls; •, GFP+ cells). Maximal values of gA were 8.82 nS in controls and 10.5 nS in GFP+ PG cells. The voltage dependencies of gA were described by Boltzmann equations with midpoints and slopes of -29.3 and 11.15 mV for controls and -27.4 and 15.1 mV for GFP+ PG cells.
Figure 4.
Figure 4.
Maturation of voltage-dependent currents in GFP+ cells. The recording from a cell in the positions is indicated by arrows. a, P32, 9 d survival. b, P28, 10 d survival. c, P31, 11 d survival.
Figure 5.
Figure 5.
Electrophysiological properties of a restricted group of GFP+ cells in the glomerular layer (see Results for explanation). a, Voltage-clamp recordings; depolarizing steps to potentials from -70 to 60 mV after 300 msec preconditioning to -120 mV. b, Current-clamp responses to the injection of depolarizing current pulses showing repetitive action potentials. c, Spontaneous activity at rest, leading to repetitive action potentials. d, Giant depolarizing synaptic potentials, occasionally seen in GFP+ cells. e, Spontaneous synaptic currents blocked by 1 mm kynurenate (recorded at P20, 10 d survival). f, Responses to focal application of GABA and glutamate (both 100 μm; P39, 17 d survival). Decay time constants were 1.64 sec for GABA and 2.33 sec for glutamate. g-i, Current-voltage relationships for INa, IK(V), and IA. INa was measured as peak inward current, IK(V) is the asymptotic current evoked by depolarizing steps from a holding potential of -50 mV in the presence of 0.1 μm TTX, and IA is the peak outward current obtained by subtracting the IK(V) currents from total outward currents evoked by depolarizing steps at identical potentials from a holding potential of -120 mV. j-l, Conductance-voltage relationships obtained by dividing the I-V data shown in g--i by the corresponding driving forces. The g-V relationships could be fitted by Boltzmann equations having the following parameters (amplitude, midpoint, and slope): gNa, 18.3 nS, -39.0 mV, 4.91 mV; gK(V), 8.26 nS, -10.4 mV, 13.7 mV; gA, 16.7 nS, -10.2 mV, 18.6 mV.
Figure 6.
Figure 6.
Electrophysiological properties of GFP+ cells in the granule cell layer. a, Current-clamp recordings; responses to the injection of squared current pulses ranging from -50 to 40 pA in steps of 10 pA. b, Voltage-clamp recordings; responses to depolarizing voltage steps ranging from -70 to 30 mV after 300 msec preconditioning at -120 mV. c, d, Current-voltage and conductance-voltage relationships for sodium current, measured at the peak after suppression of the outward current with 20 mm TEA. e, f, Current-voltage and conductance-voltage relationships for delayed-rectifier potassium current, measured at the end of 40 msec depolarizing steps.
Figure 7.
Figure 7.
Synaptic properties of newly generated PG cells. a, Spontaneous excitatory synaptic currents in a newborn cell in the glomerular layer (P27, 12 d survival). This activity was blocked by picrotoxin but not by kynurenate. b, Action potentials in response to stimulation of the ON (P26, 12 d survival). c, Synaptic currents evoked by stimulation of the ON (same cell as b). Note that the delays between the stimulus artifact and the responses shown in b and c suggest a monosynaptic contact between ON and PG cells. d, Responses to focal application of 100 μm GABA and 100 μm glutamate in GFP+ PG cells (P47, 27 d survival). e, Responses to focal GABA application (100 μm) recorded under voltage-clamp conditions in gramicidin perforated patches. The three recordings were obtained at -50, -70, and -90 mV, and their peak amplitudes are shown in f (P47, 27 d survival). f, Linear regression of the peak responses shown in e, indicating a reversal potential at -65.81 mV, corresponding to an intracellular chloride concentration of 9.75 mm. g, Example of dose-dependent GABA-induced currents in GFP+ PG cells (responses to 5, 10, 50, 100, and 200 μm). h, GABA dose-response curves for GFP+ and control PG cells (○, controls; •, GFP+ cells). EC50 were 28 and 27.7 μm, and the Hill coefficients were 1.55 and 1.23 for controls and GFP+ cells, respectively.
Figure 8.
Figure 8.
Immunohistochemical evidence of the presence of synaptic contacts in a newly generated PG cell. a, Confocal images combined to produce a three-dimensional reconstruction of a synapse on a newborn neuron. The GFP+ PG cell shown (green) is from a P34 animal, 24 d after virus injection (red, synapsin). The center image is a maximum intensity projection with orthogonal “x-z” and “y-z” views on the side to show close apposition of the PG cell process with synapsin puncta from the point indicated by the crossed lines. The image consists of 22 optical sections, each section being 0.9 μm thick. Scale bar, 8 μm. An enlargement of the synaptic contact at the center of the cross lines (arrow) is shown in the bottom right corner. b, GFP+ PG cell in a 121-d-old animal (virus injected at P87). The red dye marks the presynaptic protein SV2. The insets show strong colocalization (yellow) of the marker with GFP. Note that in b1 the synapse may actually be a dendrodendritic one. Arrowheads point to SV2 labeling within and just outside the dendrite terminal with a faint gap that is barely perceptible, dividing the two regions. Scale bars, 20 and 3 μm. c, Expression of the glutamate receptor GluR1 subunit (red) in a GFP+ PG cell (green); coexpression is indicated in yellow. Confocal images combined to produce a maximum intensity projection of a newborn neuron (inset). The PG cell shown is from a P52 animal (37 d survival). The center image is a two-channel single-optical section overlay with orthogonal x-z and y-z views along the indicated lines. The image consists of 24 optical sections, each section being 1 μm thick. Scale bar, 20 μm.

References

    1. Altman J ( 1969) Autoradiographic and histological studies of postnatal neurogenesis. IV. Cell proliferation and migration in the anterior forebrain, with special reference to persisting neurogenesis in the olfactory bulb. J Comp Neurol 137: 433-458. - PubMed
    1. Altman J, Das GD ( 1966) Autoradiographic and histological studies of postnatal neurogenesis. I. A longitudinal investigation of the kinetics, migration and transformation of cells incorporating tritiated thymidine in neonate rats, with special reference to postnatal neurogenesis in some brain regions. J Comp Neurol 126: 337-389. - PubMed
    1. Alvarez-Buylla A, Temple S ( 1998) Stem cells in the developing and adult nervous system. J Neurobiol 36: 105-110. - PubMed
    1. Baker H, Towle AC, Margolis FL ( 1988) Differential afferent regulation of dopaminergic and GABAergic neurons in the mouse main olfactory bulb. Brain Res 450: 69-80. - PubMed
    1. Baker H, Liu N, Chun HS, Saino S, Berlin R, Volpe B, Son JH ( 2001) Phenotypic differentiation during migration of dopaminergic progenitor cells to the olfactory bulb. J Neurosci 21: 8505-8513. - PMC - PubMed

Publication types

MeSH terms

LinkOut - more resources