. 2003 Nov 12;23(32):10419-32.
doi: 10.1523/JNEUROSCI.23-32-10419.2003.

Decreased anxiety, altered place learning, and increased CA1 basal excitatory synaptic transmission in mice with conditional ablation of the neural cell adhesion molecule L1

Affiliations

Decreased anxiety, altered place learning, and increased CA1 basal excitatory synaptic transmission in mice with conditional ablation of the neural cell adhesion molecule L1

Janice W S Law et al. J Neurosci. .

Abstract

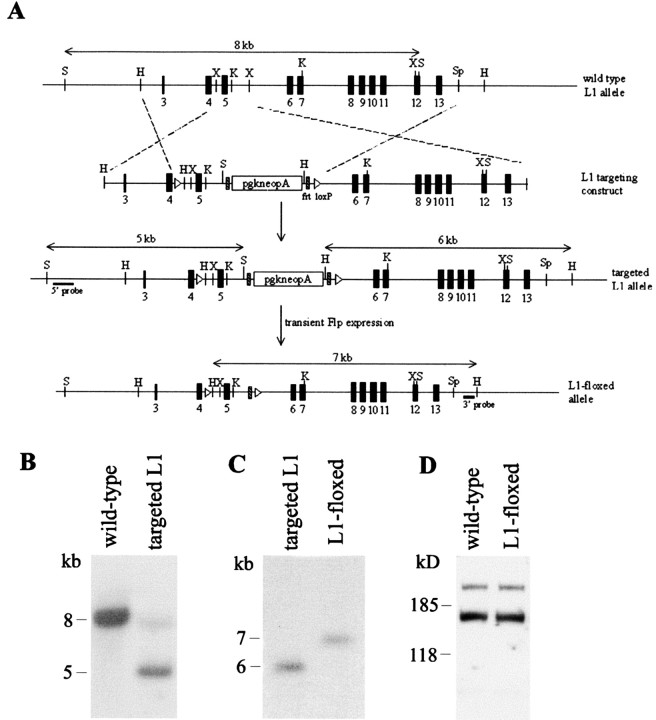
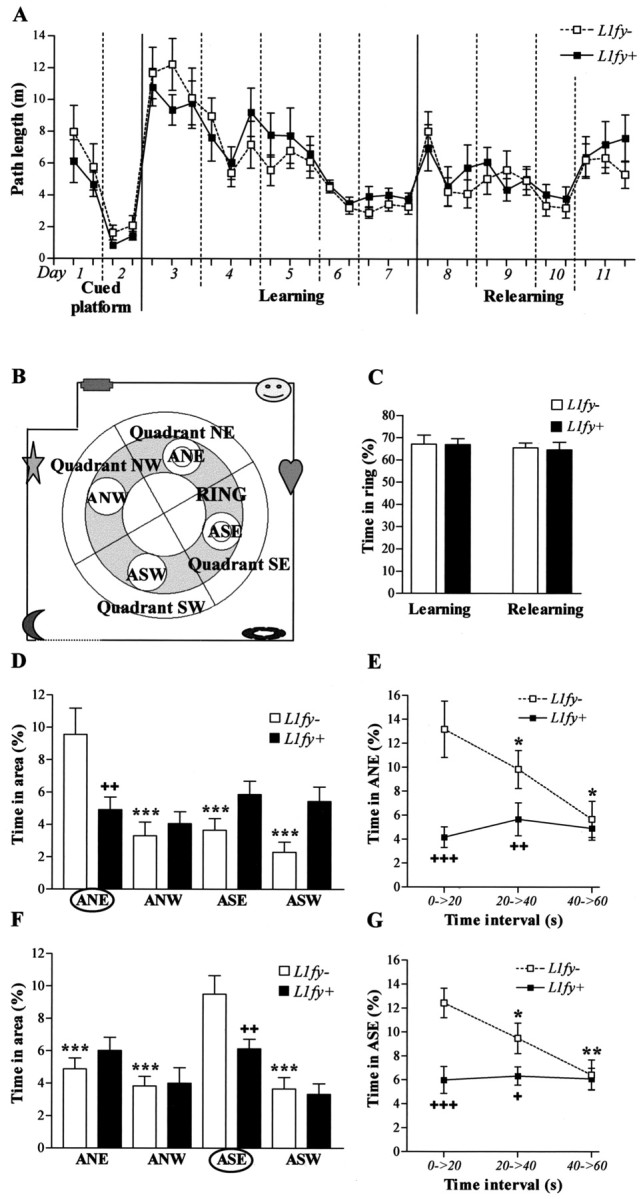
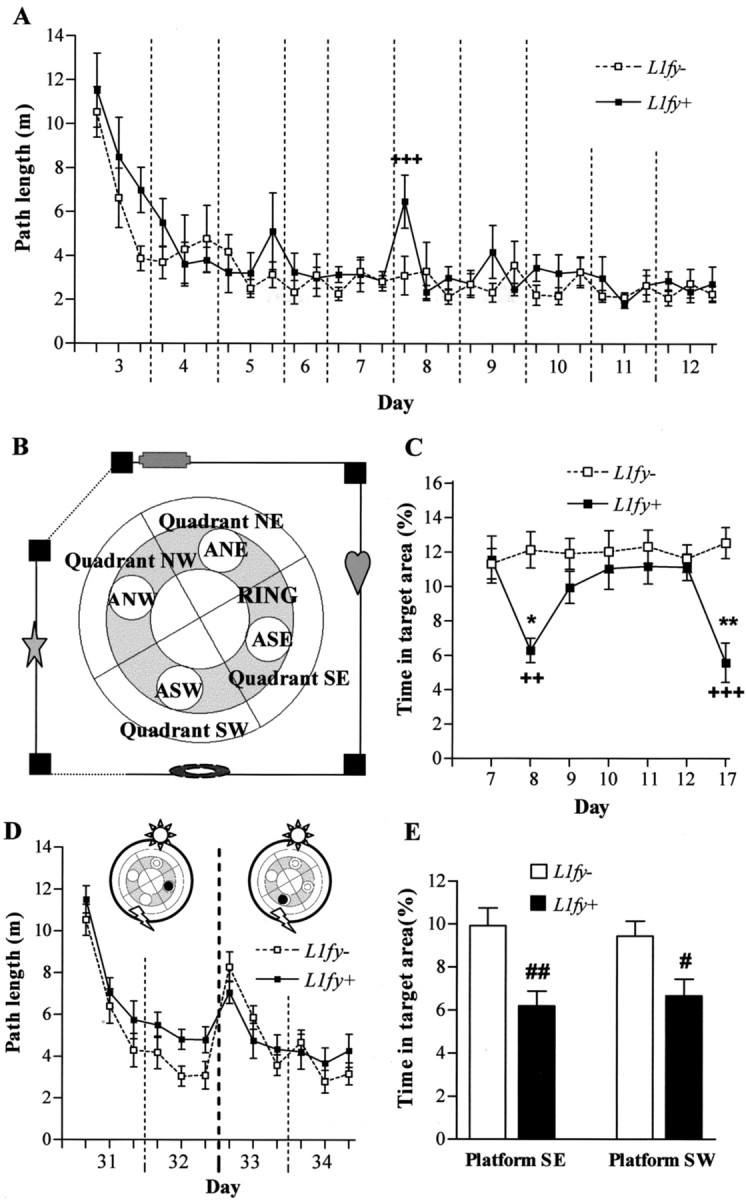
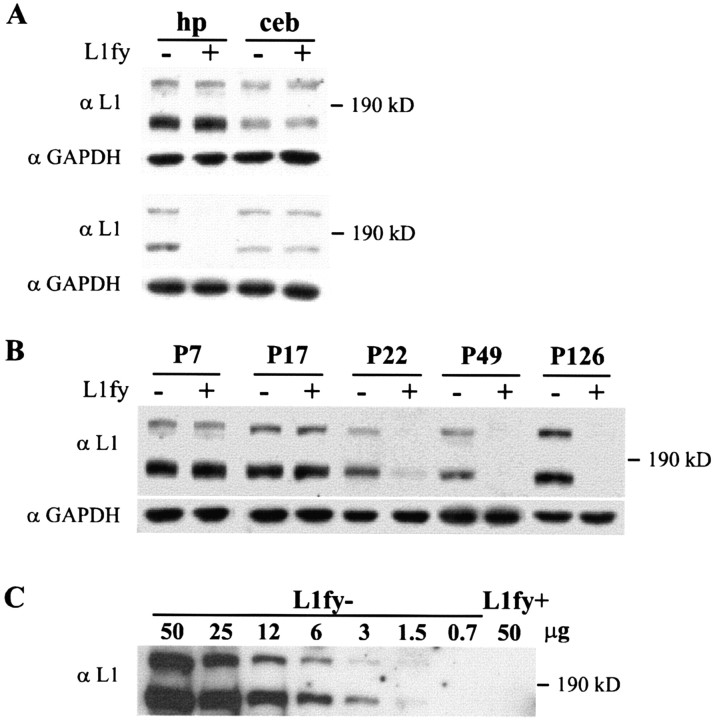
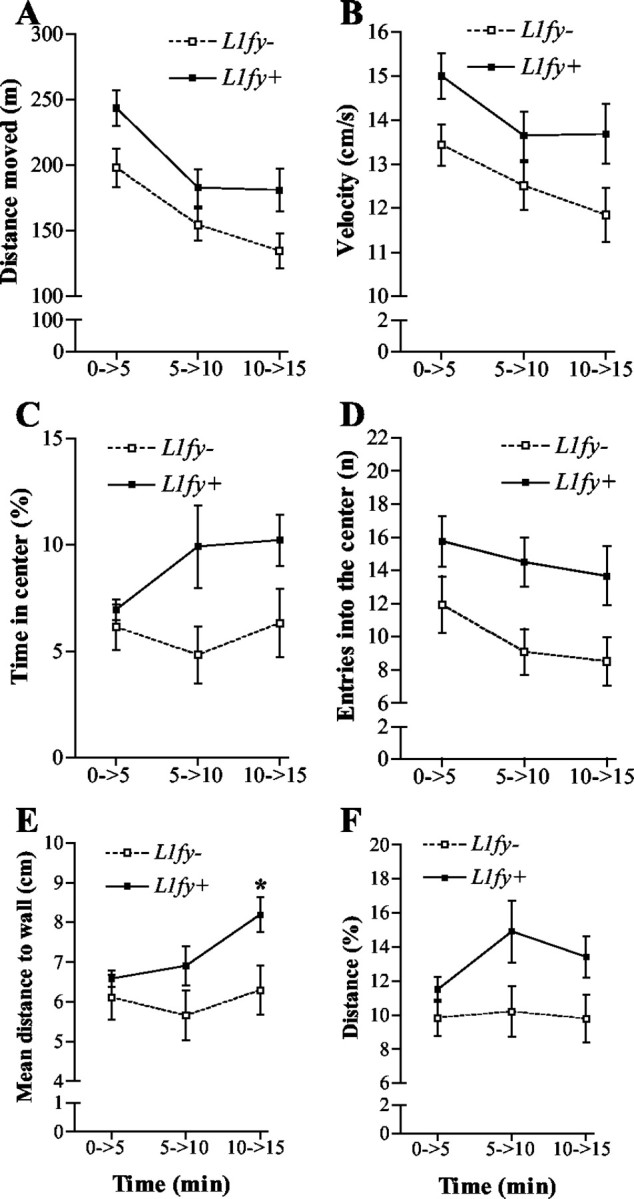
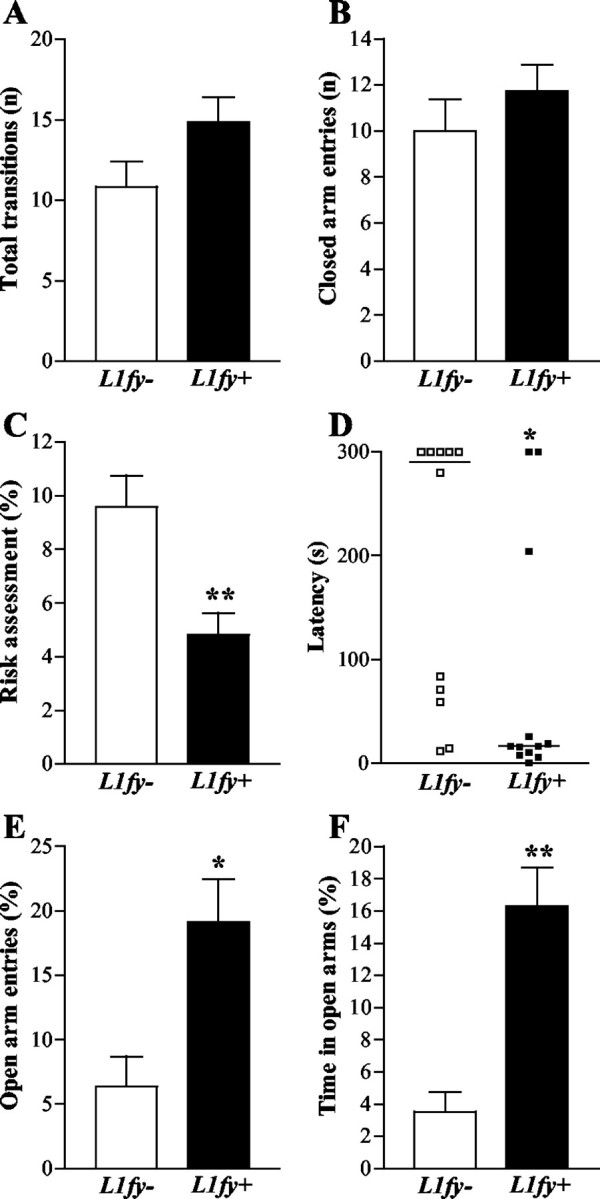
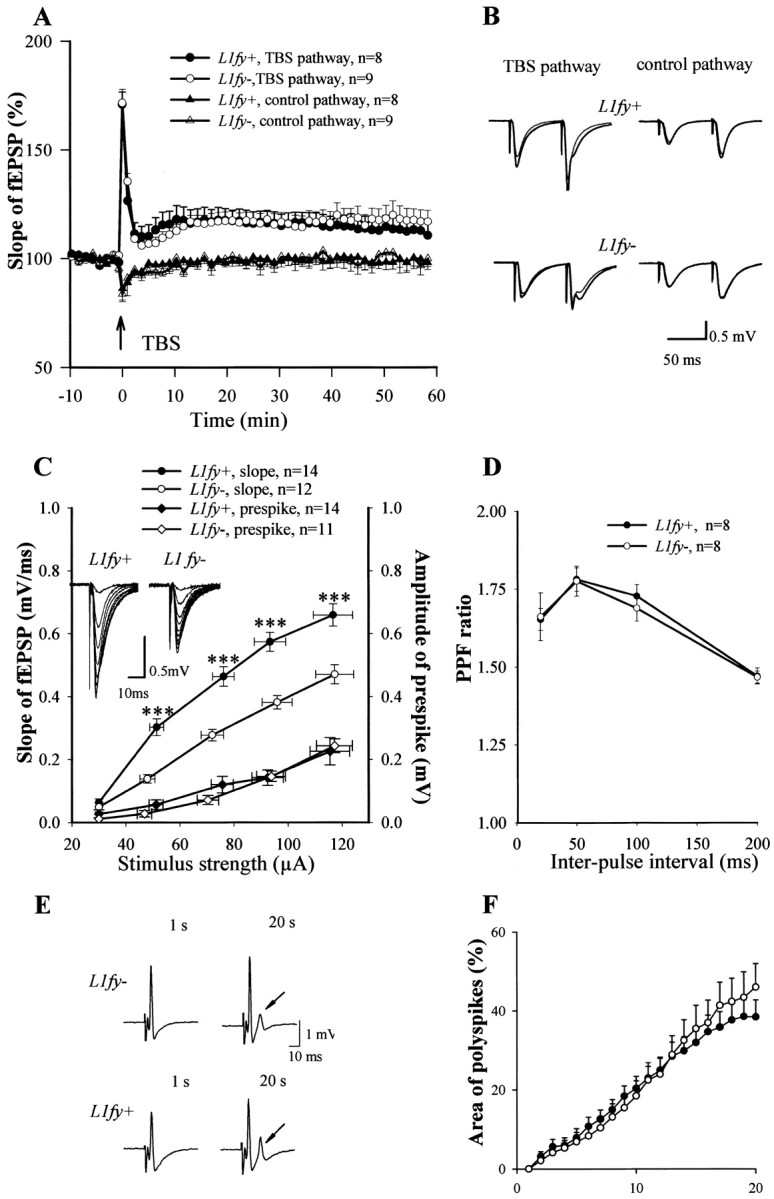
L1, a neural cell adhesion molecule of the immunoglobulin superfamily, is involved in neuronal migration and differentiation and axon outgrowth and guidance. Mutations in the human and mouse L1 gene result in similarly severe neurological abnormalities. To dissociate the functional roles of L1 in the adult brain from developmental abnormalities, we have generated a mutant in which the L1 gene is inactivated by cre-recombinase under the control of the calcium/calmodulin-dependent kinase II promoter. This mutant (L1fy+) did not show the overt morphological and behavioral abnormalities observed previously in constitutive L1-deficient (L1-/-) mice; however, there was an increase in basal excitatory synaptic transmission that was not apparent in L1-/- mice. Similar to L1-/- mice, no defects in short- and long-term potentiation in the CA1 region of the hippocampus were observed. Interestingly, L1fy+ mice showed decreased anxiety in the open field and elevated plus-maze, contrary to L1-/- mice, and altered place learning in the water maze, similar to L1-/- mice. Thus, mice conditionally deficient in L1 expression in the adult brain share some abnormalities, but also display different ones, as compared with L1-/- mice, highlighting the role of L1 in the regulation of synaptic transmission and behavior in adulthood.


Figures

Figure 1.
Figure 1.
Generation of L1-floxed mice. A, Schematic representation of the genomic organization of wild-type mouse L1, the targeting vector, the targeted L1 locus, and the neo-free loxP-flanked L1 allele. The probes used for Southern blot analysis of the genotype are indicated. H, HindIII; K, KpnI; S, SacI; Sp, SpeI; X, XbaI. B, Southern blot analysis of targeted ES cell clones. Genomic DNA was digested with SacI and hybridized with a 5′ probe. An 8 kb band was detected for the wild-type L1 allele, whereas a 5 kb band was observed for the targeted allele. Note the faint 8 kb band in the targeted allele, probably caused by contaminating DNA from wild-type ES cells. C, To excise the neomycin cassette from the targeted L1 allele, ES cell clones were transiently transfected with Flp-recombinase. Positive clones were identified by digesting genomic DNA with HindIII and hybridized with an external 3′ probe. Successful removal of the neomycin cassette produced a 7 kb band, whereas the original targeted allele gave a 6 kb band. D, Western blot analysis of L1 protein in brains of 49-d-old wild-type and L1-floxed mice using polyclonal L1 antibody. Thirty micrograms of total brain homogenates from the respective genotypes were loaded onto each lane.
Figure 8.
Figure 8.
Altered search strategy in L1fy+ mice in the water-maze experiment 1. A, Path length in the three different protocols: cued platform test, spatial learning, and spatial relearning. Each value represents the mean of two consecutive trials. No difference was detected between genotypes. B, Scheme of the experimental room. The dotted lines represent white curtains. Landmark positions at the walls are schematized. Two perpendicular lines divide the maze into four quadrants (NE, NW, SE, SW). ANE, ASE, ASW, and ANW are imaginary areas with a diameter of 28 cm, twice the diameter of the platform. The platform was located in the center of areas ANE and ASE during learning and relearning, respectively. The gray sections plus the four areas represent the ring. C, Time spent in the ring during the transfer trials performed after learning and relearning. The ring represents 35% of the total surface of the maze. Both genotypes showed a high preference to swim within the ring. D, F, Ability to search in the proximity of the platform was tested by calculating the time (percentage) spent in the area surrounding the former platform (ANE and ASE for learning and relearning, respectively). D, L1fy- mice, but not L1fy+ littermates, showed a significant preference for the target area ANE during the transfer trial performed after learning. F, L1fy- mice, but not L1fy+ mice, showed a significant preference for the target area ASE during the transfer trial performed after relearning. E, G, Time (percentage) spent in the target area at three 20 sec time intervals of the 60 sec transfer trials performed after learning and relearning, respectively. L1fy- mice, but not L1fy+ mice, showed a preference for the target area ANE during the first 40 sec of the transfer trial performed after learning (E) and relearning (G). Each value represents the genotype mean ± SEM. Significance was calculated with Newman-Keuls post hoc test after a significant effect of the interaction between genotype and the within group factor. *p < 0.05, **p < 0.01, ***p < 0.001, respectively, as compared with time spent in the target area within the same genotype (D, F) or as compared with the time spent in the target area in the previous time interval within the same genotype (E, G). +p < 0.05, ++p < 0.01, +++p < 0.001, respectively, as compared with L1fy- mice for the same area (D, F) or for the same time interval (E, G).
Figure 9.
Figure 9.
Altered use of visuospatial information in L1fy+ mice in the water-maze experiments 2 and 3. A-C, Results from experiment 2. A, Path length during acquisition in the hidden platform test. On days 8 and 9 the black stripes were absent, where as on days 10-11 they were present and the landmarks were absent. For all the other days the room was as shown in B. Each value represents the mean of two consecutive trials. L1fy+ mice needed longer paths to find the platform as compared with L1fy- littermates in the first two trials of day 8, immediately after the stripes were removed from the corners. B, Schematic representation of the experimental room. The gray sections plus the four areas represent the ring. The dotted lines represent white curtains. The positions of landmarks and black stripes at the walls and corners are schematized. Two perpendicular lines divide the pool into four quadrants (NE, NW, SE, SW). ANE, ASE, ASW, and ANW are the four areas with a diameter of 28 cm, twice the diameter of the platform. The platform was located in the center of areas ANW. C, The ability to search the platform within a small area is tested for the seven transfer trials by calculating the time (percentage) spent in the target area surrounding the platform. Although L1fy- mice always had a preference for the target area, L1fy+ mice stayed less time in the target area on the transfer trials on day 8 (stripes absent) and on day 17 (5 d after the last training). D, E, Results from Experiment 3. D, Path length during acquisition of the hidden platform protocol during experiment 3 when two landmarks were located on a black circular curtain surrounding the pool. Each value represents the mean of two consecutive trials. On training days 31-32 the platform was located in SE and on days 33-34 it was in SW. L1fy+ mice needed longer path lengths to find the platform on days 31 and 32 but not on days 33 and 34, when the platform was near one of the landmarks. E, Time spent in the target area during the transfer trials performed at the end of training days 32 and 34. L1fy+ mice spent less time as compared with L1fy- mice in the target area during both transfer trials. Each value represents the genotype mean ± SEM. +p < 0.01 and ++p < 0.001, respectively, as compared with L1fy- mice for the same trial or day; *p < 0.05 and **p < 0.01, respectively, as compared with the previous day within the same genotype (Newman-Keuls post hoc test after a significant effect of the interaction between genotype and day). #p < 0.05 and ##p < 0.01, respectively, as compared with L1fy- mice (Mann-Whitney U test).
Figure 2.
Figure 2.
Western blot analysis of L1 expression in the hippocampus and cerebellum. A, Tissue homogenates were prepared from the hippocampus (hp) and cerebellum (ceb) of L1fy- and L1fy+ mice (indicated as - and +, respectively) at P7 and P49. In each lane, 30 μg of total protein was loaded and probed with polyclonal L1 antibodies. At P7 (top panel), both the 140 and 200 kDa L1-immunoreactive bands were detectable in the brain regions analyzed, and no genotype difference in expression levels was observed. At P49 (bottom panel), no L1 immunoreactivity was detectable in the hippocampus of L1fy+ mice, whereas L1 expression was unchanged in the cerebellum. Monoclonal antibodies against GAPDH were used to control for equal protein loading. B, Hippocampus homogenates of mice at P7, P17, P22, and P126 were assayed by Western blot analysis as described in A. At P126, analysis was performed in a separate experiment with a prolonged signal exposure time to allow detection of potential L1 expression in L1fy + mice. C, Hippocampus crude lysates isolated from 49-d-old L1fy + mice. Fifty micrograms of hippocampus crude lysates isolated from L1fy+ (50 μg of protein) and L1fy- (0.7-50 μg of protein) mice were subjected to Western blot analysis to estimate the efficiency of αCaMKII-cre-mediated inactivation of L1 expression in the hippocampus. All samples were pooled from two to three animals.
Figure 3.
Figure 3.
Decreased L1 immunoreactivity in the forebrain of 5-month-old L1fy+ mice. Immunohistochemical analysis of L1 expression in the brains of a 5-month-old L1fy- mouse (A, C, E, G) and L1fy+ littermate (B, D, F, H). Coronal sections were immunostained with L1 polyclonal antibody. L1 immunoreactivity is markedly diminished in the cerebral cortex and hippocampus and thalamus (B), striatum (D), and hypothalamus (F) of L1fy+ mice as compared with L1fy- littermates (A, C, and E, respectively). L1 immunoreactivity was unchanged in the molecular layer of the cerebellum of L1fy+ mice (H) as compared with L1fy- mice (G). Scale bar: (in H) A-H, 1 mm. 3v, Third ventricle; c, cortex; cc, corpus callosum; ds, dorsal striatum; f, fimbria; h, hippocampus; ht, hypothalamus; lv, lateral ventricle; mt, mammillothalamic tract; ml, molecular layer; ot, optic tract; t, thalamus.
Figure 4.
Figure 4.
Light microscopy analysis of Nissl-stained sections of brains from 12-week-old mice. Coronal sections through the caudal region of the forebrain of an L1fy- mouse (A) and an L1fy+ littermate (B) show that the lateral ventricles in L1fy+ mice are of the same size as those of L1fy- littermates. Scale bar: (in B) A, B, 1 mm. Cross sections through the corticospinal tract of an L1fy- mouse (C) and an L1fy+ littermate (D) taken from corresponding levels of the medulla oblongata do not reveal differences between the two genotypes. Scale bar: (in D) C, D, 100 μm. Midsagittal sections through the cerebellum of an L1fy- mouse (E) and an L1fy+ littermate (F) show no signs of vermis hypoplasia in the L1fy+ mouse. Scale bar: (in F) E, F, 1 mm.
Figure 5.
Figure 5.
Histological and immunohistological analysis of hippocampi from 8-week-old mice. Nissl-stained sagittal sections of the hippocampus from L1fy- (A) and L1fy+ (E) mice. Shown are immunostainings of sagittal sections of the CA1 subfield from L1fy- (top panel) and L1fy+ (bottom panels) mice for neurofilament (B, F), parvalbumin (C, G), and GFAP (D, H). Scalebars: A, 100 μm; B, 50 μm.
Figure 6.
Figure 6.
Increased locomotion and decreased anxiety toward the center of the open field in L1fy+ mice. L1fy+ mice moved more and entered more often into the central area of the open field as compared with L1fy- littermates. The two-way ANOVA for repeated measures showed a significant effect of the genotype on distance (meters) moved (A), mean velocity (centimeters per second) (B), time (percentage) spent in the center (C), number of entries into the center (D), mean distance (centimeters) to wall (E), and distance (percentage) moved in the center and total distance moved in the arena (F) as calculated for the three consecutive 5 min intervals of the 15 min test. For mean distance to wall, there was also a significant effect of the interaction between genotype and time interval. Post hoc analyses revealed a significant difference between genotypes in the third 5 min interval. Each value represents the genotype mean ± SEM. *p < 0.05, as compared with L1fy- mice at the corresponding time interval (Newman-Keuls test after two-way ANOVA).
Figure 7.
Figure 7.
Decreased anxiety in L1fy+ mice in the elevated plus-maze. L1fy+ mice showed a higher propensity to explore the open arm of the elevated plus-maze as compared with their L1fy- littermates, whereas their general locomotor activity was unchanged. A, No difference in total transitions (entries into the open and closed arms) was detected between the two genotypes. B, Both genotypes showed ∼10 entries into the closed arms. C, L1fy+ mice spent less time (percentage), as compared with L1fy- littermates, in risk assessment toward the open arms while staying in the protected areas (closed arms and center). D, L1fy+ mice entered the open arms with lower latencies as compared with L1fy- littermates. The latencies of each mouse are shown, and the median values are indicated with a line. E, L1fy+ mice entered more often the open arms (percentage of open arm entries and open and closed arms entries) as compared with L1fy- littermates. F, L1fy+ mice spent more time (percentage) on the open arms as compared with L1fy- littermates. Each value represents the genotype mean ± SEM, except for C, where single data points are shown. *p < 0.05, **p < 0.01, respectively, as compared with L1fy- mice (Mann-Whitney U test).
Figure 10.
Figure 10.
Normal LTP and multiple population spikes but elevated basal synaptic activity in L1fy+ mice. A, LTP recorded in the CA1 subfield of hippocampal slices of L1fy+ and L1fy- mice (8-10 weeks old). TBS (indicated by arrow) of Schaffer collaterals evoked the same increase in the slopes of fEPSPs recorded in CA1 of slices from L1fy+ mice (•) as compared with L1fy- (○) littermates. Mean slope of fEPSPs recorded 0-10 min before TBS was taken as 100%. B, Averaged fEPSPs evoked by paired-pulse stimulation (interstimulus interval of 50 msec) recorded before and 60 min after TBS. C, Relationships between the stimulus strength and slope of fEPSP or amplitude of prespike-presynaptic fiber volley for L1fy+ and L1fy- mice. Data were expressed as mean ± SEM. Traces of fEPSPs evoked with different stimulus strengths (by steps of 10 μA) are shown in the insets. D, Paired-pulse facilitation (PPF) was measured as the ratio between the slopes of fEPSPs evoked by the second and first pulses and plotted for several interpulse intervals. Field EPSPs were evoked with a stimulus being 30% of the maximal subthreshold strength. Values represent mean ± SEM; n = number of tested slices prepared from five L1fy+ and five L1fy- mice. ***p < 0.001 (unpaired t test). E, Examples of population spikes evoked by stimulation of Schaffer collaterals and recorded in the stratum pyramidale of CA1. After repetitive stimulation (1 Hz for 20 sec), slices from L1fy+ mice exhibit polyspikes (multiple population spikes, arrow) at similar levels as L1fy- littermates. F, Time course of polyspike elevation during repetitive stimulation. The plot shows the area of the secondary spikes expressed as percentage of the area of the first population spike in slices from four L1fy+ (•) and four L1fy- (○) mice. n = number of hippocampal slices measured.

References

    1. Arami S, Jucker M, Schachner M, Welzl H ( 1996) The effect of continuous intraventricular infusion of L1 and NCAM antibodies on spatial learning in rats. Behav Brain Res 81: 81-87. - PubMed
    1. Benson DL, Schnapp LM, Shapiro L, Huntley GW ( 2000) Making memories stick: cell-adhesion molecules in synaptic plasticity. Trends Cell Biol 10: 473-482. - PubMed
    1. Bliss TV, Collingridge GL ( 1993) A synaptic model of memory: long-term potentiation in the hippocampus. Nature 361: 31-39. - PubMed
    1. Bliss TV, Errington M, Fransen E, Godfraind JM, Kauer JA, Kooy RF, Maness PF, Furley AJ ( 2000) Long-term potentiation in mice lacking the neural cell adhesion molecule L1. Curr Biol 10: 1607-1610. - PubMed
    1. Chamizo VD ( 2002) Spatial learning: conditions and basic effects. Psico-lógica 23: 35-57.

Publication types

MeSH terms