

doi: 10.1073/pnas.2334996100.
Epub 2003 Nov 13.
On the relation between fluctuation and response in biological systems
Affiliations
- PMID: 14615583
- PMCID: PMC283550
- DOI: 10.1073/pnas.2334996100
Item in Clipboard
On the relation between fluctuation and response in biological systems
Proc Natl Acad Sci U S A.
.
Abstract
A general relationship between fluctuation and response in a biological system is presented. The fluctuation is given by the variance of some quantity, whereas the response is given as the average change of that quantity for a given parameter change. We propose a relationship where the two are proportional, in a similar way to the fluctuation-dissipation theorem in physics. By studying an evolution experiment where fluorescence of protein in bacteria increases, we confirm our relation by observing a positive correlation between the speed of fluorescence evolution and the phenotypic fluctuation of the fluorescence over clone bacteria. The generality of the relationship as well as its relevance to evolution is discussed.
Figures
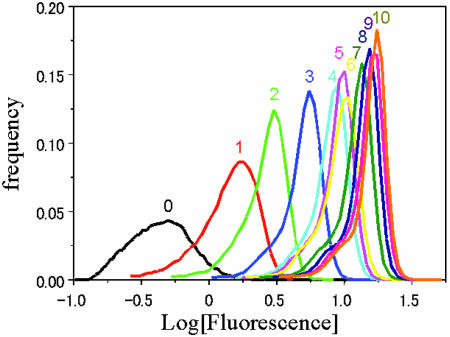
Histogram of the logarithm of fluorescence intensity for each generation, in the experiment described in the text. The number above the peak of each distribution indicates its generation number. We evaluated the fluorescence intensity of each E. coli in each generation by dividing its measured fluorescence intensity value (FL) by its forward scatter (FS) value measured with the cytometry, because the FS value roughly indicates the size of E. coli, whereas the FL value is usually proportional to the FS value.
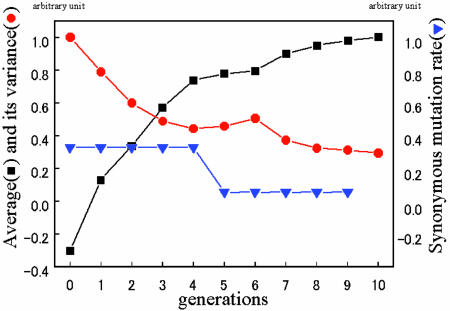
The average (black squares) and variance (red circles) of fluorescence over clone cells selected at each generation, plotted vs. the generation number. The average values and variances are computed from the Gaussian-like distributions as their peak position and half-width in Fig. 1. The synonymous mutation rate for each generation, which was determined by DNA sequencing, is also plotted as blue triangles.
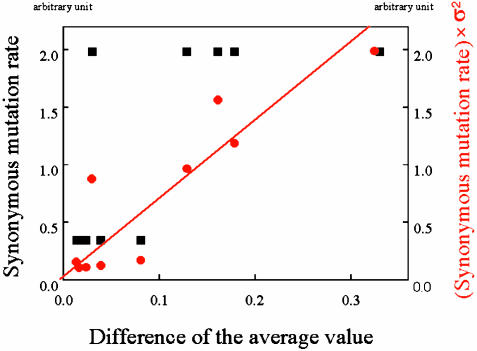
σ2 (variance of fluorescence intensity) multiplied by Δa (synonymous mutation rate) is plotted vs. the change of average fluorescence intensity as red circles by using the data from Fig. 2. The red line is a linear fit to the data, which turn out to pass through the origin. For reference, the synonymous mutation rate Δa vs. the change of average fluorescence intensity value is also plotted as black squares. The correlation coefficient for the linear fit is 0.79, whereas that for the synonymous mutation rate (black squares) is 0.21.
Similar articles
-
How selection affects phenotypic fluctuation.Mol Syst Biol. 2009;5:264. doi: 10.1038/msb.2009.23. Epub 2009 Apr 28. Mol Syst Biol. 2009. PMID: 19401676 Free PMC article.
-
Influence of topology on bacterial social interaction.Proc Natl Acad Sci U S A. 2003 Nov 25;100(24):13910-5. doi: 10.1073/pnas.1935975100. Epub 2003 Nov 17. Proc Natl Acad Sci U S A. 2003. PMID: 14623970 Free PMC article.
-
Machine-Learning-Guided Mutagenesis for Directed Evolution of Fluorescent Proteins.ACS Synth Biol. 2018 Sep 21;7(9):2014-2022. doi: 10.1021/acssynbio.8b00155. Epub 2018 Aug 20. ACS Synth Biol. 2018. PMID: 30103599
-
The dynamic microbe: green fluorescent protein brings bacteria to light.Mol Microbiol. 2002 Sep;45(5):1191-6. doi: 10.1046/j.1365-2958.2002.03089.x. Mol Microbiol. 2002. PMID: 12207688 Review.
-
Fluorescence photobleaching analysis for the study of cellular dynamics.Eur Biophys J. 2002 Mar;31(1):36-51. doi: 10.1007/s00249-001-0202-2. Eur Biophys J. 2002. PMID: 12046896 Review.
Cited by
-
Emergent expression of fitness-conferring genes by phenotypic selection.PNAS Nexus. 2022 Jun 10;1(3):pgac069. doi: 10.1093/pnasnexus/pgac069. eCollection 2022 Jul. PNAS Nexus. 2022. PMID: 36741458 Free PMC article.
-
How selection affects phenotypic fluctuation.Mol Syst Biol. 2009;5:264. doi: 10.1038/msb.2009.23. Epub 2009 Apr 28. Mol Syst Biol. 2009. PMID: 19401676 Free PMC article.
-
A developmental basis for stochasticity in floral organ numbers.Front Plant Sci. 2014 Nov 3;5:545. doi: 10.3389/fpls.2014.00545. eCollection 2014. Front Plant Sci. 2014. PMID: 25404932 Free PMC article.
-
A quantitative study of lambda-phage SWITCH and its components.Biophys J. 2007 Apr 15;92(8):2685-93. doi: 10.1529/biophysj.106.097089. Epub 2007 Jan 26. Biophys J. 2007. PMID: 17259278 Free PMC article.
-
Conflict between noise and plasticity in yeast.PLoS Genet. 2010 Nov 4;6(11):e1001185. doi: 10.1371/journal.pgen.1001185. PLoS Genet. 2010. PMID: 21079670 Free PMC article.
References
-
- Tang, K. E. S. & Dill, K. A. (1998) J. Biomol. Struct. Dyn. 16, 397–411. - PubMed
-
- Ishijima, A., Kojima, H., Funatsu, T., Tokunaga, M., Higuchi, H., Tanaka, H. & Yanagida, T. (1998) Cell 92, 161–171. - PubMed
-
- Osawa, F. (1975) J. Theor. Biol. 52, 175–186. - PubMed
-
- Elowitz, M. B., Levine, A. J., Siggia, E. D. & Swain, P. S. (2002) Science 297, 1183–1186. - PubMed
Publication types
MeSH terms
Substances
Grants and funding
LinkOut - more resources
Full Text Sources
