Review
. 2003 Dec;56(6):588-99.
doi: 10.1046/j.1365-2125.2003.01892.x.

Pulmonary drug delivery. Part I: physiological factors affecting therapeutic effectiveness of aerosolized medications

Affiliations
Review

Pulmonary drug delivery. Part I: physiological factors affecting therapeutic effectiveness of aerosolized medications

N R Labiris et al. Br J Clin Pharmacol. 2003 Dec.

Abstract

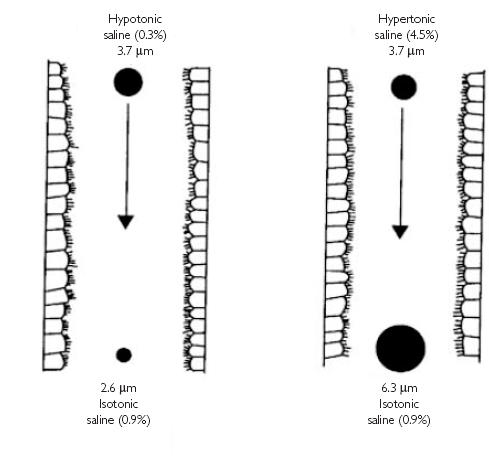
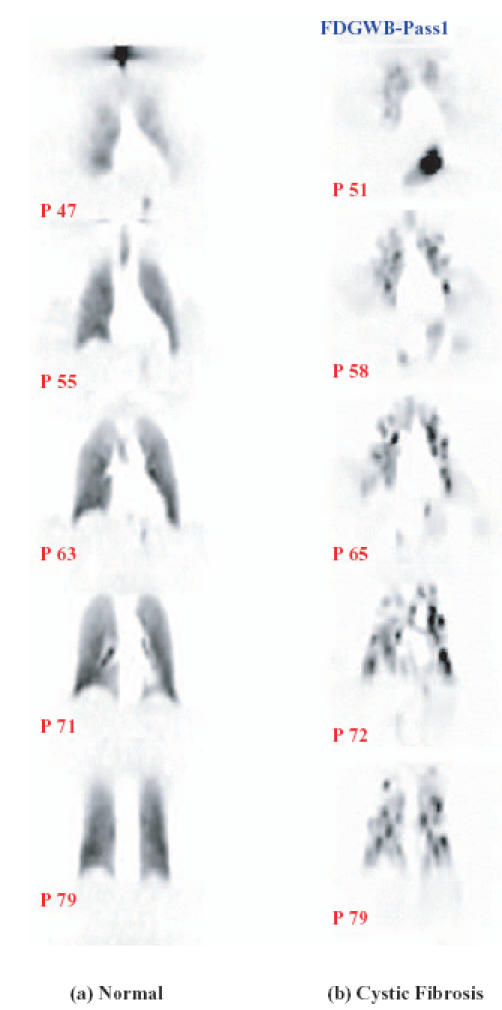
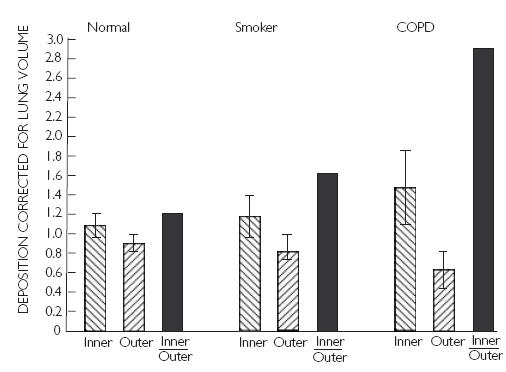
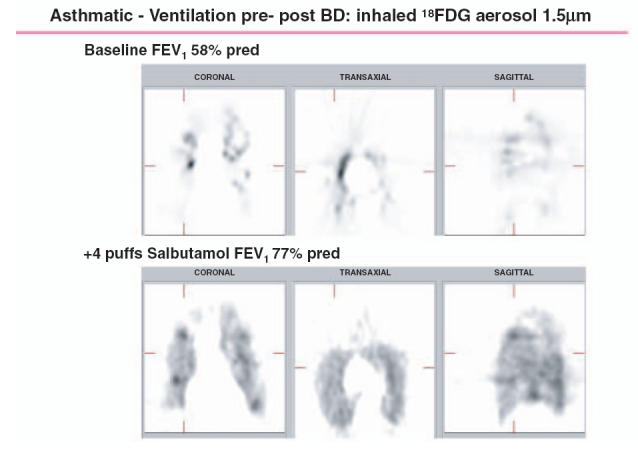
As the end organ for the treatment of local diseases or as the route of administration for systemic therapies, the lung is a very attractive target for drug delivery. It provides direct access to disease in the treatment of respiratory diseases, while providing an enormous surface area and a relatively low enzymatic, controlled environment for systemic absorption of medications. As a major port of entry, the lung has evolved to prevent the invasion of unwanted airborne particles from entering into the body. Airway geometry, humidity, mucociliary clearance and alveolar macrophages play a vital role in maintaining the sterility of the lung and consequently are barriers to the therapeutic effectiveness of inhaled medications. In addition, a drug's efficacy may be affected by where in the respiratory tract it is deposited, its delivered dose and the disease it may be trying to treat.


Figures

Figure 1
Figure 1
The effect of the drug aerosol's particle size on therapeutic efficacy. (a) Percent improvement in forced expiratory volume in 1 s (FEV1) following inhalation of two different size aerosols of salbutamol, 3.3 µm and 7.7 µm. The dose–response curves show that, for the β-agonist, salbutamol, the small particle aerosol (3.3 µm) produced a greater bronchodilator response at all doses compared with the larger particle size aerosol. (b) Percent improvement in FEV1 following inhalation of two different size aerosols of ipratropium bromide, 3.3 µm and 7.7 µm. For the muscarinic antagonist, ipratropium bromide, there were no significant differences in the dose–response curves between the two aerosols. (From Johnson MA et al. Chest 1989; 96: 1–10 [9].)
Figure 2
Figure 2
Positron emission tomography emission slices for all three planes following inhalation of 18fluorodeoxyglucose (18FDG) of two different particle sizes in a cystic fibrosis patient [age 23; forced expiratory volume in 1 s (FEV1) 57% of predicted]. (a) Ultravent nebulizer: mass median aerodynamic diameter (MMAD) 1.5 µm, fine particle fraction (FPF) of 95% (measured with Andersen Cascade Impactor at 28.3 Lpm). (b) Pari LC Star nebulizer: MMAD 4.5 µm, FPF for FDG aerosol of 65%. Although a difference in distribution is evident with the two sizes of aerosols, distribution of the small particle aerosol (1.5 µm) is non-uniform with the aerosol being centrally distributed. The darker areas (hotspots) on the scans are points of impaction, possibly at airway obstructions. (Reproduced with permission of the author [63].)
Figure 3
Figure 3
Relationship between particle size and lung deposition. (Reprinted with permission of the author [32].)
Figure 4
Figure 4
Frequency (a) and cumulative (b) distribution curves for Beclovent metered dose inhaler (MDI) used with an Aerochamber, in terms of number of particles and volume (mass) of particles vs. particle aerodynamic diameter. The volume distribution curves are displaced to the right of the number distribution curves. The smaller number of large particles within the aerosol carry the greater mass of the drug; this is reflected in the larger, second peak of the volume distribution curve, which corresponds to the smaller second peak of the number distribution curve. Mass median aerodynamic diameter (MMAD) is read from the cumulative distribution curve at the 50% point and if the distribution is log-normal, the geometric standard deviation (GSD) can be calculated as the ratio of the diameter at the 84.1% point to the MMAD. Particle distribution was measured using the Anderson Cascade Impactor. (Reprinted with permission of the author [72].)
Figure 5
Figure 5
Illustration of hygroscopic growth and shrinkage of hypertonic and hypotonic droplets of the same initial size (3.7 µm) in the humid environment of the respiratory tract. (From Phipps PR et al. Regional deposition of saline aerosols of different tonicities in normal and asthmatic subjects. Eur Respir J 1994; 7: 1474–1482 [40].)
Figure 6
Figure 6
A section of sequential coronal lung slices (from anterior to posterior) following inhalation of a 4.5-µm 18fluorodeoxyglucose (18FDG) aerosol in (A) normal volunteer with forced expiratory capacity in 1 s (FEV1) of 98% predicted (images on left side) and (B) cystic fibrosis (CF) patient with FEV1 of 57% predicted (images on right side). A uniform distribution of the aerosol is seen in the normal lung compared with the non-uniform, central distribution of the same aerosol in CF. (Reproduced with permission of the author [63].)
Figure 7
Figure 7
Differences in the lung distribution of the same radioactive aerosol among normals, smokers and chronic obstructive pulmonary disease (COPD) subjects. Inner zone represents centrally deposited aerosol and outer represents the aerosol deposited peripherally, both expressed as striped columns. The inner : outer ratio is expressed by solid column. Deposition in the periphery of the lung is greatly decreased in COPD and to a lesser extent in smokers compared with normals. The reverse is seen in the central airways, with more aerosol being deposited in this region for subjects with COPD and smokers. The inner : outer ratio illustrates the different pattern of deposition in the three groups. (Reprinted with permission of author [67].)
Figure 8
Figure 8
Positron emission tomography scans (one example per plane) showing marked improvement in ventilation post-bronchodilator in an asthmatic subject. Deposition of 18 fluorodeoxyglucose (18FDG) aerosol (1.5 µm MMD) was poor presalbutamol. (Reproduced with permission from author [63].)

Similar articles

Cited by

References

    1. Dolovich M. New propellant-free technologies under investigation. J Aerosol Med. 1999;12(Suppl 1):s9–s17. - PubMed
    1. Welbanks L, editor. Compendium of pharmaceuticals and specialties. 35. Ottawa, Ontario: CPS Canadian Pharmacists Association; 2000.
    1. Byron PR. Inhalation devices. In: D'Arcy PF, Mcelnay JC, editors. The pharmacy and pharmacotherapy of asthma. Chichester: Ellis Horwood Ltd; 1989. pp. 47–69.
    1. Ruffin RE, Dolovich MB, Wolff RK, Newhouse MT. The effects of preferential deposition of histamine in the human airway. Am Rev Respir Dis. 1978;117:485–492. - PubMed
    1. Carstairs JR, Nimmo AJ, Barnes PJ. Autoradiographic visualization of beta-adrenoceptor subtypes in human lung. Am Rev Respir Dis. 1985;132:541–547. - PubMed

MeSH terms