Comparative Study
. 2003 Nov 25;100(24):14339-44.
doi: 10.1073/pnas.2036282100. Epub 2003 Nov 14.

Comprehensive transposon mutant library of Pseudomonas aeruginosa

Affiliations
Comparative Study

Comprehensive transposon mutant library of Pseudomonas aeruginosa

Michael A Jacobs et al. Proc Natl Acad Sci U S A. .

Abstract

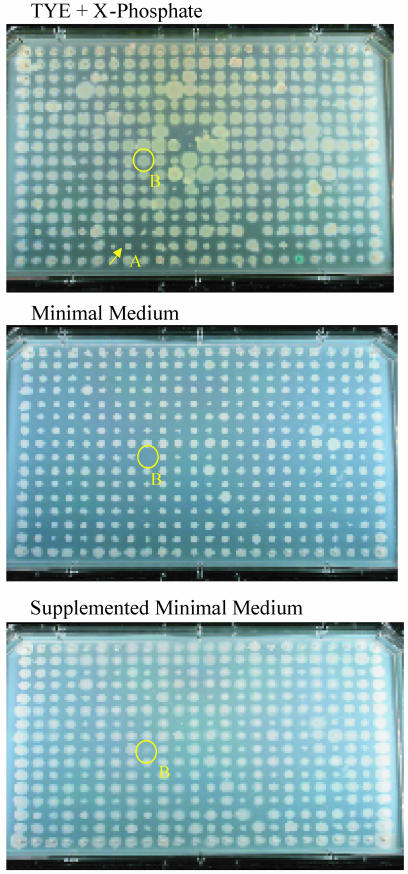
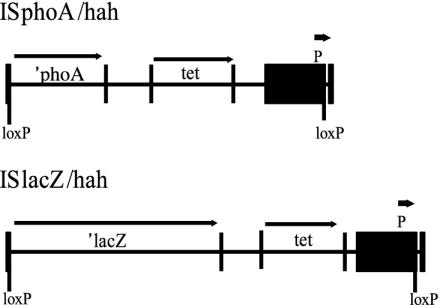
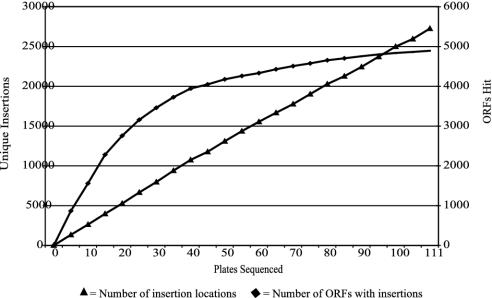
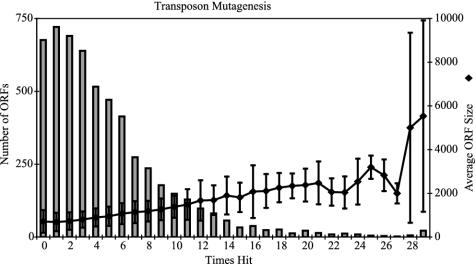
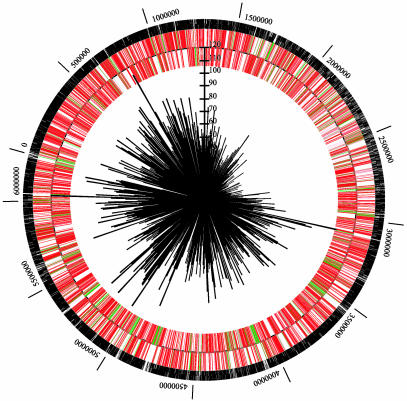
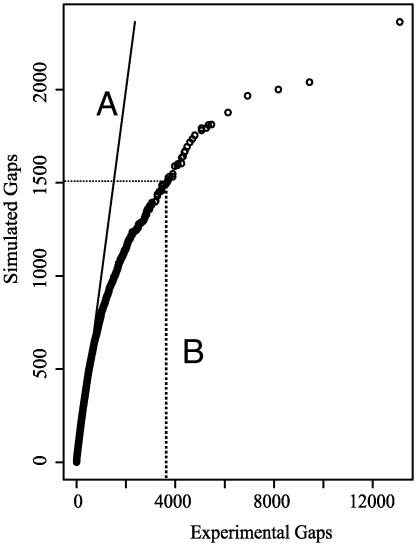
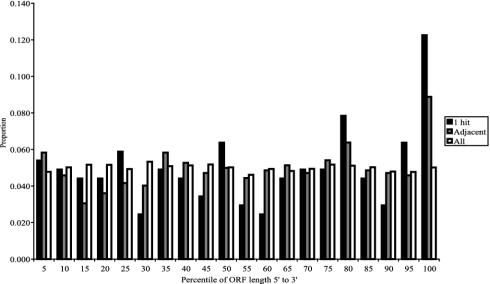
We have developed technologies for creating saturating libraries of sequence-defined transposon insertion mutants in which each strain is maintained. Phenotypic analysis of such libraries should provide a virtually complete identification of nonessential genes required for any process for which a suitable screen can be devised. The approach was applied to Pseudomonas aeruginosa, an opportunistic pathogen with a 6.3-Mbp genome. The library that was generated consists of 30,100 sequence-defined mutants, corresponding to an average of five insertions per gene. About 12% of the predicted genes of this organism lacked insertions; many of these genes are likely to be essential for growth on rich media. Based on statistical analyses and bioinformatic comparison to known essential genes in E. coli, we estimate that the actual number of essential genes is 300-400. Screening the collection for strains defective in two defined multigenic processes (twitching motility and prototrophic growth) identified mutants corresponding to nearly all genes expected from earlier studies. Thus, phenotypic analysis of the collection may produce essentially complete lists of genes required for diverse biological activities. The transposons used to generate the mutant collection have added features that should facilitate downstream studies of gene expression, protein localization, epistasis, and chromosome engineering.


Figures

Fig. 7.
Fig. 7.
Replica plating and phenotyping. One 384-well plate of phoA transposon-containing strains was replica plated onto three conditions: rich medium plus indicator (Top), minimal medium (Middle), and minimal medium plus supplemented nutrients (Bottom). (Top) Colony A (arrow) represents a twitch- phenotype; thus, the mutant is deficient in the gene pilY1, a type-4 fimbrial biogenesis protein. Colony B (circled) is an auxotrophic mutant (showing growth on LB and supplemented, but not minimal, media) and carries an argG (argininosuccinate synthetase) insertion.
Fig. 1.
Fig. 1.
Transposons used for insertion mutagenesis. Transposons ISphoA/ hah (4.83 kbp) and ISlacZ/hah (6.16 kbp) are derived from the IS50L element of transposon Tn5 and generate alkaline phosphatase (′phoA) or β-galactosidase (′lacZ) translational gene fusions if appropriately inserted in a target gene. An outward-facing neomycin phosphotransferase promoter is expected to reduce polar effects on downstream gene expression for appropriately oriented insertions. Cre-mediated recombination excises sequences situated between the loxP sites in each transposon, leaving a 63-codon insertion that encodes an influenza-hemagglutinin epitope and a hexahistidine metal-affinity purification tag (together referred to as ”hah,” see ref. 10). ′phoA, alkaline phosphatase gene; ′lacZ, β-galactosidase gene; tet, tetracycline resistance determinant; loxP, Cre recognition sequence; P, neomycin phosphotransferase promoter.
Fig. 2.
Fig. 2.
Saturation transposon mutagenesis. A total of 110 384-well plates of transposon-containing strains of P. aeruginosa were analyzed for transposon insertion location. Insertions were mapped to 27,263 locations within ORFs with another 2,837 between ORFs. Of the 5,570 ORFs in the P. aeruginosa genome, 4,892 were hit at least once by a transposon insertion. The number of unique insertion locations increased linearly with new strains, whereas the number of ORFs hit approached a plateau.
Fig. 3.
Fig. 3.
Distribution of transposon hits among ORFs. The number of ORFs for which a transposon insertion wasn't recovered was 678, and 721 were hit only once. The number of times an ORF was hit increases with ORF size. Error bars are one standard deviation in each direction.
Fig. 4.
Fig. 4.
Distribution of transposon insertions and candidate-essential genes. The circular 6.2-Mbp P. aeruginosa genome was hit in 30,100 locations with individual transposon insertions. The black circular line represents the genome sequence with the origin of replication at coordinate zero. Bars outside the line represent genes transcribed clockwise, whereas those inside are transcribed counterclockwise. Red bars represent ORFs that contain transposon insertions, and green bars represent ORFs not hit (candidate-essential genes). Black marks on the outside of the circle represent transposon insertions. The sunburst pattern represents the number of insertions per 10,000 bp, with the scale extending from the center.
Fig. 5.
Fig. 5.
Quantile-quantile plot of transposon-insertion gap size distribution. The 30,100-transposon insertion locations in the 6.2-Mbp P. aeruginosa genome were compared with an equal number of random insertions in a simulated 6.2-Mbp genome. The x axis represents the observed size distribution of gaps (the distance between adjacent insertions) and the y axis represents the simulated distribution of gaps. Each point plots the same quantile for both distributions. Line A represents a 1:1 relationship, where the points would lie if the observed and the randomly generated data sets were identical. The size distribution of the observed gaps is significantly larger than that of the random data set. For example, an equal proportion of gaps fell below 3,800 bp in the observed data set as fell below 1,500 bp in the random data set (represented by line B).
Fig. 6.
Fig. 6.
Hit distribution relative to position within ORF. The proportion of transposon insertions according to their relative position within ORFs is represented in a histogram. Hits are nearly evenly distributed (e.g., 5% of hits occur in the first 5% of ORFs) when all insertions are considered. For ORFs that were hit only once (dark gray), particularly those adjacent to ORFs never hit, the proportion of hits is highly skewed toward the 3′ end of the gene.

References

    1. Giaever, G., Chu, A. M., Ni, L., Connelly, C., Riles, L., Veronneau, S., Dow, S., Lucau-Danila, A., Anderson, K., Andre, B., et al. (2002) Nature 418, 387-391. - PubMed
    1. Kobayashi, K., Ehrlich, S. D., Albertini, A., Amati, G., Andersen, K. K., Arnaud, M., Asai, K., Ashikaga, S., Aymerich, S., Bessieres, P., et al. (2003) Proc. Natl. Acad. Sci. USA 100, 4678-4683. - PMC - PubMed
    1. Berg, C. M. & Berg, D. E. (1995) in Mobile Genetic Elements, ed. Sherratt, D. (Oxford Univ. Press, Oxford), pp. 38-68.
    1. Kumar, A., des Etages, S. A., Coelho, P. S., Roeder, G. S. & Snyder, M. (2000) Methods Enzymol. 328, 550-574. - PubMed
    1. Ross-Macdonald, P., Coelho, P. S., Roemer, T., Agarwal, S., Kumar, A., Jansen, R., Cheung, K. H., Sheehan, A., Symoniatis, D., Umansky, L., et al. (1999) Nature 402, 413-418. - PubMed

Publication types

LinkOut - more resources