

Changes of plasma interleukin-1 receptor antagonist, interleukin-8 and other serologic markers during chemotherapy in patients with active pulmonary tuberculosis
- PMID: 14619382
- PMCID: PMC4531628
- DOI: 10.3904/kjim.2003.18.3.138
Changes of plasma interleukin-1 receptor antagonist, interleukin-8 and other serologic markers during chemotherapy in patients with active pulmonary tuberculosis
Abstract
Background: The human immune response to Mycobacterium tuberculosis is mediated by macrophages and T-lymphocytes. The alveolar macrophage phagocyting mycobacterium produces interleukin (IL)-1 as an inflammatory mediator, and IL-8 as a cytokine for leukocyte recruitment and granuloma formation. Interleukin-1 receptor antagonist (IL-1ra) is an internal antagonist of IL-1.
Methods: Plasma levels of IL-1ra and IL-8 and other serologic markers were measured in 18 patients with active tuberculosis before treatment and after 2 months and 6 months of treatment.
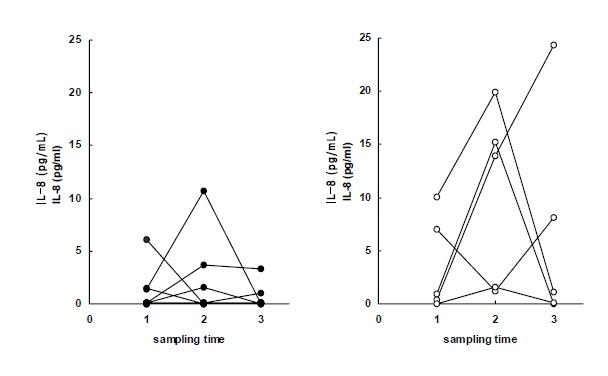
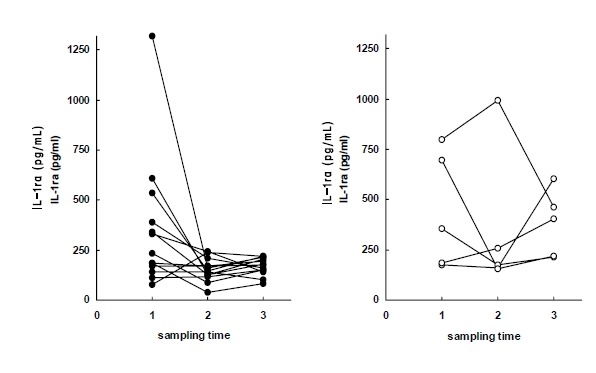
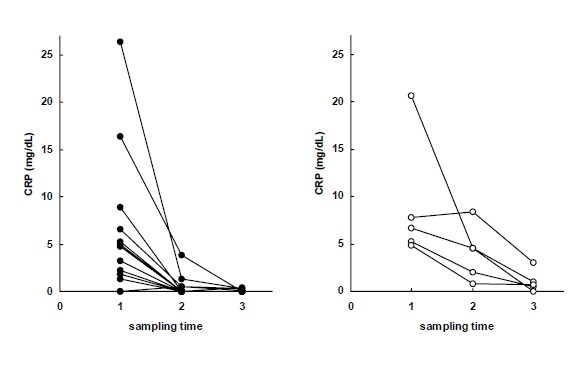
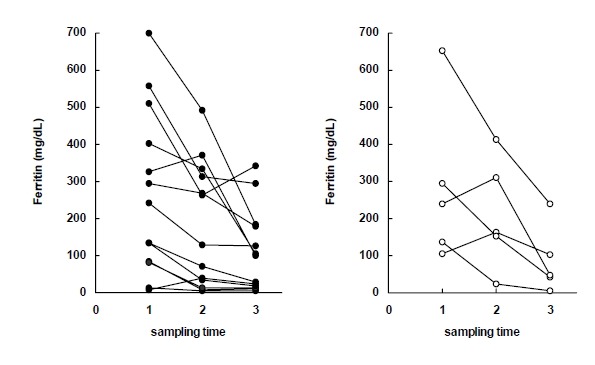
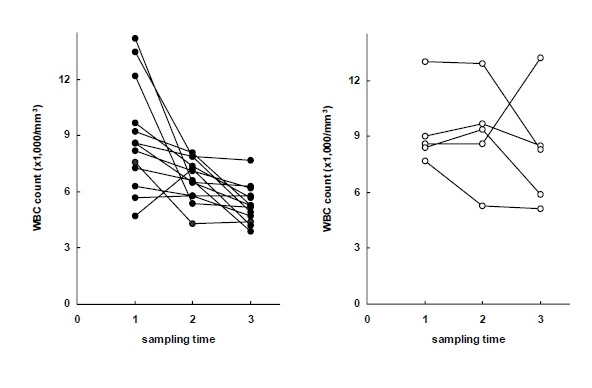
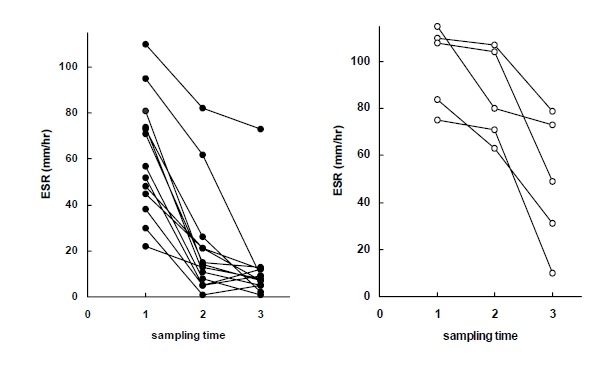
Results: During treatment with antituberculous medication, patients showed significant changes in hemoglobin, hematocrit, white blood cells (WBC), platelet, erythrocyte sedimentation rate (ESR), C-reactive protein (CRP), ferritin and plasma IL-1ra. After 2 months of treatment, ESR and CRP diminished significantly; after 6 months, hemoglobin increased while WBC, platelet, ESR, CRP and ferritin decreased significantly compared to their pre-treatment levels. There were two groups: patients with delayed therapeutic responses, and patients with early responses. At each point of observation, the former group of patients showed lower body weight and lower levels of hemoglobin and hematocrit, and higher levels of WBC, platelet, ESR, IL-8 and IL-1ra than the latter group. During the course of the treatment, we observed considerable differences in body weight, body mass index, hemoglobin, hematocrit, WBC and platelet counts, ESR, CRP and ferritin in both the early-response and delayed-response groups.
Conclusion: We believe that the plasma concentrations of IL-1ra and IL-8, which showed different peaks during the course of treatment, reflected their different functions and patterns of secretion. Moreover the concentrations did not seem as sensitive as other inflammatory markers to evaluate disease activity during antituberculosis treatment. However, IL-1ra can be considered a marker for disease activity and response to treatment.
Figures
Similar articles
-
Reduction of inflammation after administration of interleukin-1 receptor antagonist following aneurysmal subarachnoid hemorrhage: results of the Subcutaneous Interleukin-1Ra in SAH (SCIL-SAH) study.J Neurosurg. 2018 Feb;128(2):515-523. doi: 10.3171/2016.9.JNS16615. Epub 2017 Feb 24. J Neurosurg. 2018. PMID: 28298024 Clinical Trial.
-
Increased circulating levels of interleukin-1 receptor antagonist in patients with inflammatory bowel disease.Kurume Med J. 1998;45(1):33-7. doi: 10.2739/kurumemedj.45.33. Kurume Med J. 1998. PMID: 9658748 Clinical Trial.
-
High altitude increases circulating interleukin-6, interleukin-1 receptor antagonist and C-reactive protein.Cytokine. 2000 Mar;12(3):246-52. doi: 10.1006/cyto.1999.0533. Cytokine. 2000. PMID: 10704252
-
Increasing levels of interleukin (IL)-1Ra and IL-6 during the first 2 days of hospitalization in unstable angina are associated with increased risk of in-hospital coronary events.Circulation. 1999 Apr 27;99(16):2079-84. doi: 10.1161/01.cir.99.16.2079. Circulation. 1999. PMID: 10217645
-
Imbalances between tumor necrosis factor-alpha and its soluble receptor forms, and interleukin-1beta and interleukin-1 receptor antagonist in BAL fluid of cavitary pulmonary tuberculosis.Chest. 2000 Jan;117(1):103-9. doi: 10.1378/chest.117.1.103. Chest. 2000. PMID: 10631206
Cited by
-
Serum level of IL-1ra was associated with the treatment of latent tuberculosis infection in a Chinese population.BMC Infect Dis. 2020 May 8;20(1):330. doi: 10.1186/s12879-020-05047-x. BMC Infect Dis. 2020. PMID: 32384874 Free PMC article. Clinical Trial.
-
Improving Assignments for Therapeutic and Prophylactic Treatment Within TB Households. A Potential for Immuno-Diagnosis?Front Immunol. 2022 Mar 17;13:801616. doi: 10.3389/fimmu.2022.801616. eCollection 2022. Front Immunol. 2022. PMID: 35401549 Free PMC article.
-
Biomarkers to identify Mycobacterium tuberculosis infection among borderline QuantiFERON results.Eur Respir J. 2022 Aug 10;60(2):2102665. doi: 10.1183/13993003.02665-2021. Print 2022 Aug. Eur Respir J. 2022. PMID: 35058249 Free PMC article.
-
Serum and CSF cytokines and matrix metalloproteinases in spinal tuberculosis.Inflamm Res. 2015 Feb;64(2):97-106. doi: 10.1007/s00011-014-0786-5. Epub 2014 Dec 12. Inflamm Res. 2015. PMID: 25503789
-
Efficacy of T Regulatory Cells, Th17 Cells and the Associated Markers in Monitoring Tuberculosis Treatment Response.Front Immunol. 2018 Feb 5;9:157. doi: 10.3389/fimmu.2018.00157. eCollection 2018. Front Immunol. 2018. PMID: 29472922 Free PMC article.
References
-
- Daniel TM, Boom WH, Ellner JJ. Immunology of tuberculosis. In: Reichman LB, Hershfield ES, editors. Tuberculosis: a comprehensive international approach. 2nd ed. New York: Marcel Dekker; 2000. pp. 187–214.
-
- Barnes PF. Tuberculosis. In: Nelson S, Martin TR, editors. Cytokines in pulmonary disease. New York: Marcel Dekker; 2000. pp. 189–212.
-
- Toossi Z, Gogate P, Shiratsuchi H, Young T, Ellner JJ. Enhanced production of TGF-beta by blood monocytes from patients with active tuberculosis and presence of TGF-beta in tuberculosis granulomatous lung lesions. J Immunol. 1995;154:465–473. - PubMed
-
- Stenger S, Mazzaccaro RJ, Uyemura K, Cho S, Barnes PF, Rosat JP, Sette A, Brenner MB, Procelli SA, Bloom BR, Modlin RL. Differential effects of cytolytic T cell subsets on intracellular infection. Science. 1997;276:1684–1687. - PubMed
Publication types
MeSH terms
Substances
LinkOut - more resources
Full Text Sources
Research Materials
Miscellaneous