

Complex independent component analysis of frequency-domain electroencephalographic data
- PMID: 14622887
- PMCID: PMC2925861
- DOI: 10.1016/j.neunet.2003.08.003
Complex independent component analysis of frequency-domain electroencephalographic data
Abstract
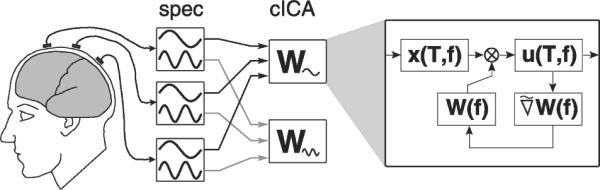
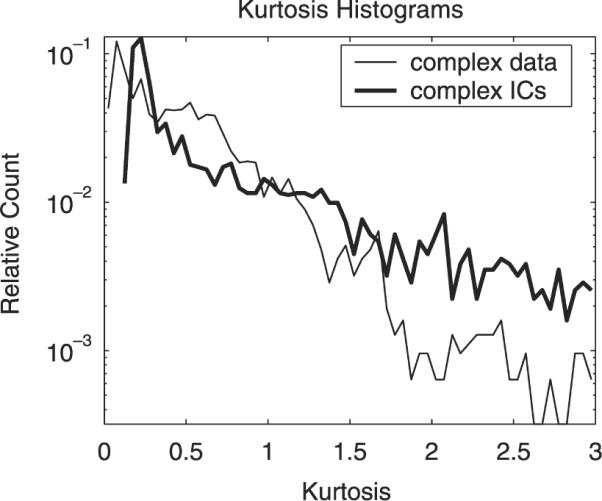
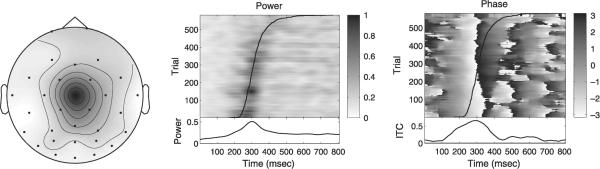
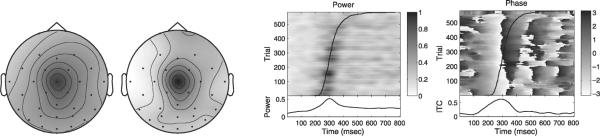
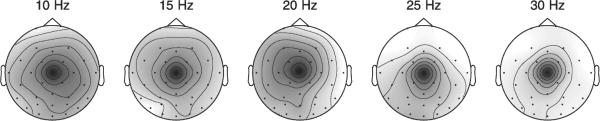
Independent component analysis (ICA) has proven useful for modeling brain and electroencephalographic (EEG) data. Here, we present a new, generalized method to better capture the dynamics of brain signals than previous ICA algorithms. We regard EEG sources as eliciting spatio-temporal activity patterns, corresponding to, e.g. trajectories of activation propagating across cortex. This leads to a model of convolutive signal superposition, in contrast with the commonly used instantaneous mixing model. In the frequency-domain, convolutive mixing is equivalent to multiplicative mixing of complex signal sources within distinct spectral bands. We decompose the recorded spectral-domain signals into independent components by a complex infomax ICA algorithm. First results from a visual attention EEG experiment exhibit: (1). sources of spatio-temporal dynamics in the data, (2). links to subject behavior, (3). sources with a limited spectral extent, and (4). a higher degree of independence compared to sources derived by standard ICA.
Figures
Similar articles
-
Decoding underlying brain activities in time and frequency domains through complex independent component analysis of EEG signals.Annu Int Conf IEEE Eng Med Biol Soc. 2014;2014:3192-5. doi: 10.1109/EMBC.2014.6944301. Annu Int Conf IEEE Eng Med Biol Soc. 2014. PMID: 25570669
-
Recording human electrocorticographic (ECoG) signals for neuroscientific research and real-time functional cortical mapping.J Vis Exp. 2012 Jun 26;(64):3993. doi: 10.3791/3993. J Vis Exp. 2012. PMID: 22782131 Free PMC article.
-
Application and Evaluation of Independent Component Analysis Methods to Generalized Seizure Disorder Activities Exhibited in the Brain.Clin EEG Neurosci. 2017 Jul;48(4):295-300. doi: 10.1177/1550059416677915. Epub 2016 Nov 11. Clin EEG Neurosci. 2017. PMID: 27837050
-
[Independent Components Analysis (ICA) in the study of electroencephalographic signals].Neurologia. 2005 Jul-Aug;20(6):299-310. Neurologia. 2005. PMID: 16007513 Review. Spanish.
-
Independence: a new criterion for the analysis of the electromagnetic fields in the global brain?Neural Netw. 2000 Oct-Nov;13(8-9):891-907. doi: 10.1016/s0893-6080(00)00073-3. Neural Netw. 2000. PMID: 11156200 Review.
Cited by
-
Disentangling early sensory information processing deficits in schizophrenia.Clin Neurophysiol. 2012 Oct;123(10):1942-9. doi: 10.1016/j.clinph.2012.02.079. Epub 2012 May 18. Clin Neurophysiol. 2012. PMID: 22608970 Free PMC article.
-
Polarimetric detection of maritime floating small target based on the Complex-valued Entropy Rate Bound Minimization.Heliyon. 2020 Oct 9;6(10):e05138. doi: 10.1016/j.heliyon.2020.e05138. eCollection 2020 Oct. Heliyon. 2020. PMID: 33088941 Free PMC article.
-
Neurophysiologic markers of abnormal brain activity in schizophrenia.Curr Psychiatry Rep. 2010 Dec;12(6):572-8. doi: 10.1007/s11920-010-0149-z. Curr Psychiatry Rep. 2010. PMID: 20857348 Free PMC article. Review.
-
Bistability and non-Gaussian fluctuations in spontaneous cortical activity.J Neurosci. 2009 Jul 1;29(26):8512-24. doi: 10.1523/JNEUROSCI.0754-09.2009. J Neurosci. 2009. PMID: 19571142 Free PMC article.
-
Quality Map Thresholding for De-noising of Complex-Valued fMRI Data and Its Application to ICA of fMRI.J Signal Process Syst. 2009 Sep 1;2009:1-6. doi: 10.1007/s11265-010-0536-z. J Signal Process Syst. 2009. PMID: 21949563 Free PMC article.
References
-
- Amari S, Cichocki A, Yang HH. A new learning algorithm for blind signal separation. In: Touretzky D, Mozer M, Hasselmo M, editors. Advances in neural information processing systems. Vol. 8. MIT Press; Cambridge, MA: 1996. pp. 757–763.
-
- Anemüller J. PhD thesis. Department of Physics, University of Oldenburg; Oldenburg, Germany: 2001. Across-Frequency processing in convolutive blind source separation. http://medi.uni-oldenburg.de/members/ane.
-
- Anemüller J, Kollmeier B. Adaptive separation of acoustic sources for anechoic conditions: A constrained frequency domain approach. Speech Communication. 2003;39(1–2):79–95.
-
- Arieli A, Sterkin A, Grinvald A, Aertsen A. Dynamics of ongoing activity: Explanation of the large variability in evoked cortical responses. Science. 1996;273:1868–1871. - PubMed
-
- Bell AJ, Sejnowski TJ. An information maximization approach to blind separation and blind deconvolution. Neural Computation. 1995;7:1129–1159. - PubMed
Publication types
MeSH terms
Grants and funding
LinkOut - more resources
Full Text Sources
Other Literature Sources
Miscellaneous
