. 2003 Nov 24;163(4):847-57.
doi: 10.1083/jcb.200308162. Epub 2003 Nov 17.

Autoregulation of E-cadherin expression by cadherin-cadherin interactions: the roles of beta-catenin signaling, Slug, and MAPK

Affiliations

Autoregulation of E-cadherin expression by cadherin-cadherin interactions: the roles of beta-catenin signaling, Slug, and MAPK

Maralice Conacci-Sorrell et al. J Cell Biol. .

Abstract

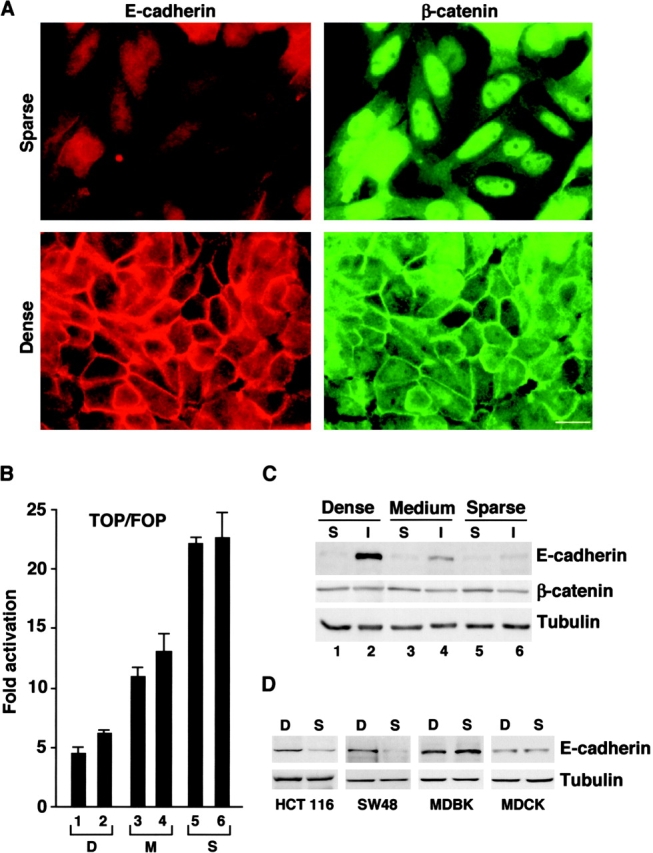
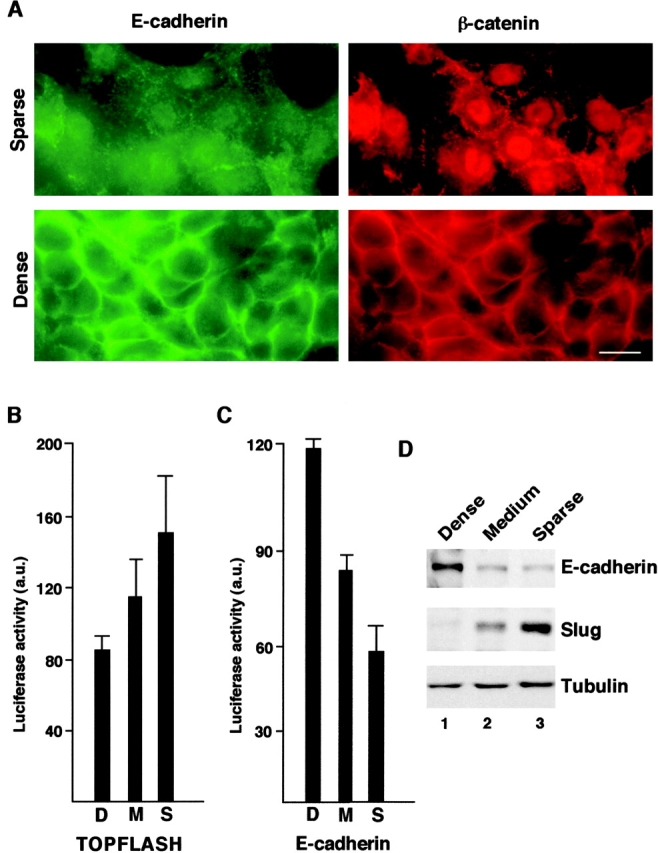
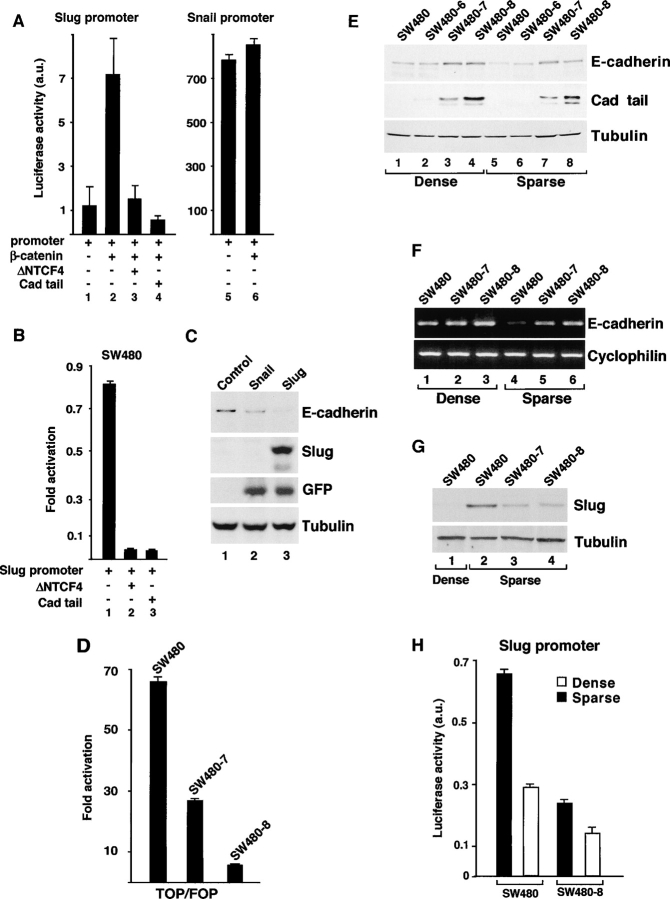
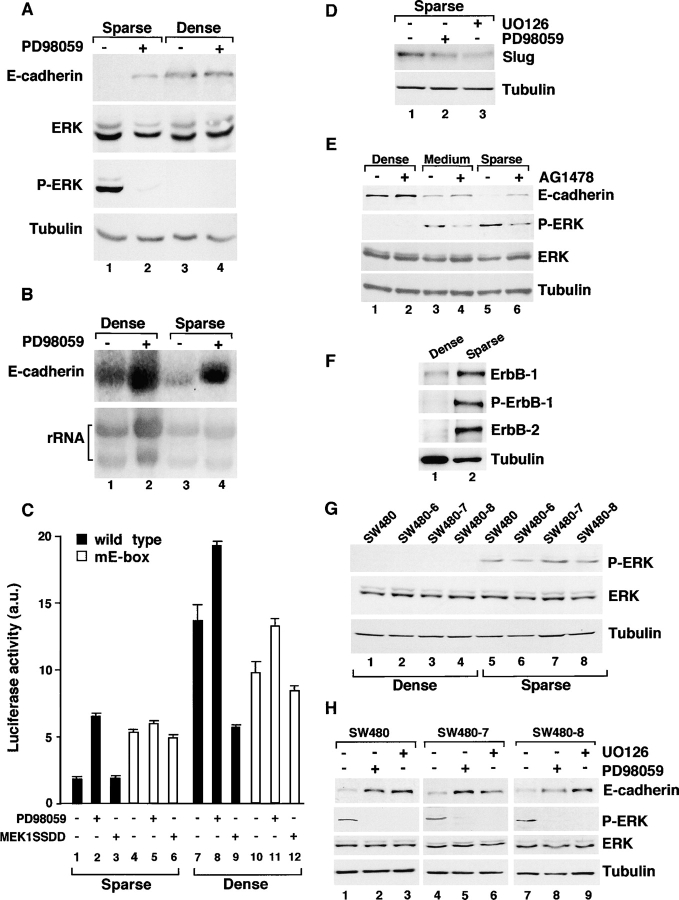
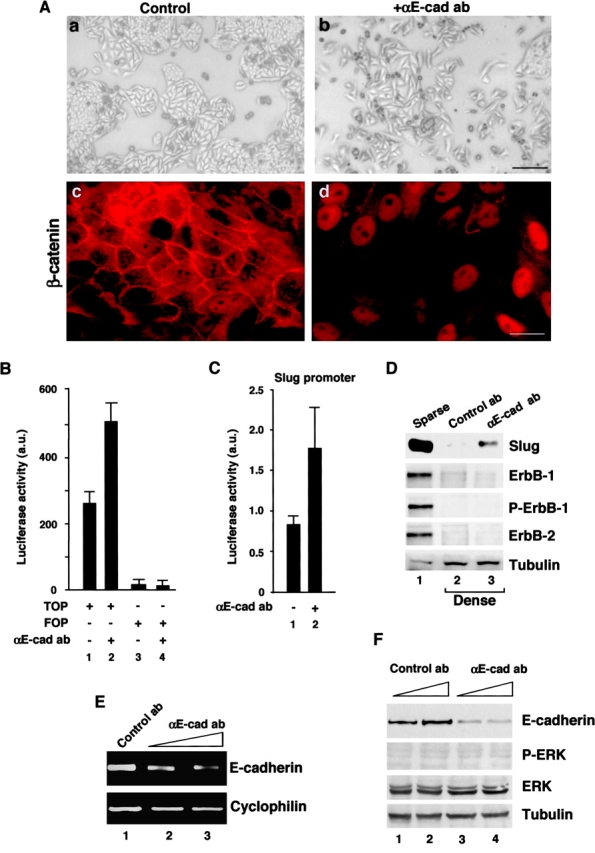
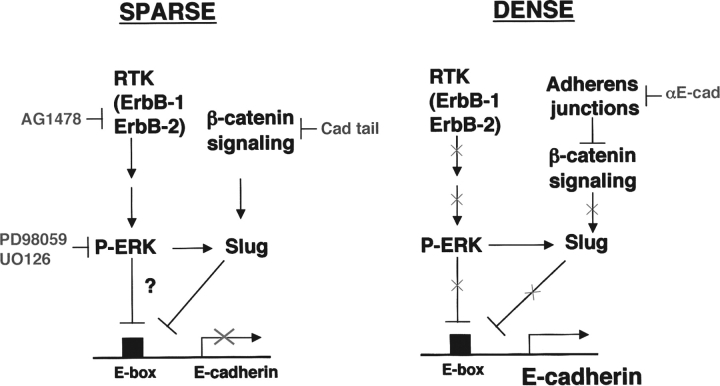
Transcriptional repression of E-cadherin, characteristic of epithelial to mesenchymal transition, is often found also during tumor cell invasion. At metastases, migratory fibroblasts sometimes revert to an epithelial phenotype, by a process involving regulation of the E-cadherin-beta-catenin complex. We investigated the molecular basis of this regulation, using human colon cancer cells with aberrantly activated beta-catenin signaling. Sparse cultures mimicked invasive tumor cells, displaying low levels of E-cadherin due to transcriptional repression of E-cadherin by Slug. Slug was induced by beta-catenin signaling and, independently, by ERK. Dense cultures resembled a differentiated epithelium with high levels of E-cadherin and beta-catenin in adherens junctions. In such cells, beta-catenin signaling, ErbB-1/2 levels, and ERK activation were reduced and Slug was undetectable. Disruption of E-cadherin-mediated contacts resulted in nuclear localization and signaling by beta-catenin, induction of Slug and inhibition of E-cadherin transcription, without changes in ErbB-1/2 and ERK activation. This autoregulation of E-cadherin by cell-cell adhesion involving Slug, beta-catenin and ERK could be important in tumorigenesis.


Figures

Figure 1.
Figure 1.
Regulation of E-cadherin expression and β-catenin localization and signaling by cell density. (A) SW480 cells were seeded from a semi-confluent culture dish at 6 × 10³ cells/cm2 (sparse) and 6 × 10⁴ cells/cm2 (dense), and after 2 d double stained for E-cadherin and β-catenin. (B) Cells cultured at different densities: lane 1, 6 × 10⁴ cells/cm2; lane 2, 3 × 10⁴ cells/cm2; lane 3, 2 × 10⁴ cells/cm2; lane 4, 1.5 × 10⁴ cells/cm2; lane 5, 104 cells/cm2; and lane 6, 8 × 10³ cells/cm2 were transiently transfected with TOPFLASH (TOP) or FOPFLASH (FOP) reporters and fold activation was determined in duplicate dishes. S, sparse; M, medium; D, dense. The error bars represent the mean ± SD from triplicate plates. (C) Cells grown at different densities were fractionated into Triton X-100–soluble (S) and –insoluble (I) fractions and equal volumes (from equal numbers of cells) were analyzed by Western blotting for E-cadherin, β-catenin, and tubulin levels. (D) HCT116, SW48, colon cancer cells, and MDCK and MDBK normal epithelial cells were grown as sparse (6 × 10³ cells/cm2) and dense (6 × 10⁴ cells/cm2) cultures, and the levels of E-cadherin and tubulin were determined. Note induction of E-cadherin expression, relocalization of β-catenin to the membrane and inhibition of β-catenin–mediated transactivation in dense SW480 cells. Bar, 10 μm.
Figure 2.
Figure 2.
Inhibition of E-cadherin expression in sparse cultures by Slug. (A) SW480 cells were seeded at: lane 1, 6 × 10³ cells/cm2; lane 2, 2 × 10⁴ cells/cm2; lane 3, 4 × 10⁴ cells/cm2; and lane 4, 8 × 10⁴ cells/cm2), and the level of E-cadherin, Slug, Snail, and GAPDH poly(A)-RNA was determined by Northern blot hybridization with 32P-labeled cDNA probes. (B) Cells from a confluent dish were seeded as sparse or dense cultures (as in Fig. 1 A), and at different times the level of Slug was determined by Western blot analysis of adherent cells using equal amounts of total protein. (C) Dense cultures were transfected with an E-cadherin promoter reporter and 14 h later the cells were seeded as sparse and dense cultures and promoter activity determined at different times after plating. (D) Sparse and dense cultures were transfected with WT mouse E-cadherin promoter reporter (wt), an E-box mutant promoter (mE-box), with or without a Slug cDNA plasmid and luciferase activity was determined. (E) Human and mouse WT E-cadherin promoter reporters were transfected into 293-T cells in the presence and absence of Slug and luciferase activity determined. (C–E) The error bars represent the mean ± SD from triplicate plates. (F) SW480 cells were transfected with a plasmid coding for both GFP and Slug, or histone-GFP, and stained for E-cadherin with rhodamine-labeled secondary antibody. Note that Slug expression correlated with reduced E-cadherin level, it inhibited the WT E-cadherin promoter and reduced E-cadherin expression in transfected cells. The arrows point to E-cadherin in adherens junctions of histone-GFP transfected cells. Bar, 10 μm.
Figure 3.
Figure 3.
Regulation of E-cadherin, Slug, and β-catenin localization and signaling by cell density in HCT116 cells. (A) HCT116 cells were seeded as sparse and dense cultures (Fig. 1) and after 48 h the cells were double stained for E-cadherin and β-catenin. (B) Cells were seeded at different densities (as in Fig. 1A) and transfected with TOPFLASH, FOPFLASH, or (C) with the E-cadherin promoter reporter, and promoter activities were determined. (B and C) The error bars represent the mean ± SD from triplicate plates. (D) The levels of E-cadherin and Slug were determined by Western blot analysis 30 h after cell seeding at the densities indicated in Fig. 1 A. Bar, 10 μm.
Figure 4.
Figure 4.
Activation of Slu g transcription by β-catenin–TCF signaling. (A and B) Activation of mouse Slug, but not Snail, promoter by β-catenin in 293-T (A), and of the Slug promoter in SW480 cells (B). Inhibition of Slug promoter activation by dominant negative TCF (ΔNTCF4) and the cytoplasmic tail of cadherin (Cad tail). (C) Transfection of Slug, and to a lesser extent Snail, into 293-T cells reduces endogenous E-cadherin levels. Cells were transfected with a plasmid coding for Slug and GFP, or Snail and GFP, and the levels of GFP, Slug, and E-cadherin were determined by Western blotting. (D) Decreased β-catenin/TCF–mediated transactivation in SW480 clones (SW480–7 and SW480–8) stably expressing the cadherin tail. (E) SW480 clones expressing the cadherin tail displayed elevated E-cadherin protein, (F) increased E-cadherin RNA (by RT-PCR), and (G) decreased Slug protein and (H) lower Slug promoter activity. (A, B–D, and H) The error bars represent the mean ± SD from triplicate plates.
Figure 5.
Figure 5.
ERK activation and β-catenin signaling can independently regulate E-cadherin expression via Slug. (A) Activation of ERK was inhibited in sparse and dense cultures by incubating cells for 24 h with PD98059 and the level of E-cadherin, total ERK, P-ERK, and tubulin were determined by Western blot analysis. (B) The effect of PD98059 on E-cadherin RNA levels was determined by Northern blot hybridization in sparse and dense cultures of SW480 cells. (C) The effect of PD98059 and activated ERK (MEK1SSDD) on WT E-cadherin and E-box mutant promoter (mE-box) activity was determined in sparse and dense cultures. The error bars represent the mean ± SD from triplicate plates. (D) Inhibition of ERK activation by PD98059 and UO126 in sparse cultures reduced the level of Slug. (E) The RTK inhibitor tyrphostin AG1478 inhibited ERK activation and elevated E-cadherin expression in sparse cultures but not in dense cultures. (F) The levels of ErbB-1 and ErbB-2 and the phosphorylation of ErbB-1 (P-ErbB-1) were determined in sparse and dense cultures. (G) SW480 clones expressing the cytoplasmic tail of cadherin displayed unaltered P-ERK levels compared with control SW480 cells and, (H) inhibition of ERK activation in these cells by PD98059 and UO126 elevated E-cadherin levels.
Figure 6.
Figure 6.
Inhibition of E-cadherin–E-cadherin interactions in dense SW480 cultures induces nuclear localization and signaling by β-catenin, elevates Slug expression and reduces E-cadherin levels. (A) SW480 cells were seeded as dense cultures in the presence of a polyclonal anti–E-cadherin antibody (αE-cad), or control antibody, and cell morphology and the organization of β-catenin (by anti–β-catenin antibody staining) were determined. (B) Cells were first transfected with TOPFLASH, FOPFLASH, or the Slug reporter plasmid and seeded in the presence of 1:50 dilution of anti–E-cadherin or control antibody. (B) The activities of TOPFLASH (TOP) or control, FOPFLASH (FOP), and (C) the Slug promoter were determined. (B and C) The error bars represent the mean ± SD from triplicate plates. (D) The levels of Slug, ErbB-1, P-ErbB-1, and ErbB-2, were determined in sparse and dense cultures and in dense cultures incubated with anti–E-cadherin antibody. (E) E-cadherin RNA levels were determined by RT-PCR. (F) The levels of E-cadherin protein, total ERK, activated ERK (P-ERK) and tubulin were determined by Western blot analysis of lysates from cells incubated with 1:10 (lanes 2 and 4) and 1:50 dilutions (lanes 1 and 3) of the control and anti–E-cadherin antibodies. Note that antibody-mediated inhibition of E-cadherin–mediated adhesion resulted in nuclear localization of β-catenin, elevation in Slug, and reduction in E-cadherin expression, but no changes in ErbB-1/ErbB-2 and ERK activation. Bars: (A, d) 10 μm; (A, b) 60 μm.
Figure 7.
Figure 7.
Mechanisms of E-cadherin regulation in sparse and dense cultures of colon cancer cells. In sparse cultures, E-cadherin expression is suppressed by two different mechanisms. One involves activation of ERK (P-ERK) by receptor tyrosine kinases (RTK), such as ErbB-1 and ErbB-2. ERK activation induces Slug that inhibits E-cadherin expression by binding to the E-box of E-cadherin. The other pathway includes Slug induction by the β-catenin–TCF pathway. In dense cultures, the ERK pathway is inactive, the levels of ErbB-1, ErbB-2, and Slug are repressed and E-cadherin expression increases. This leads to recruitment of nuclear β-catenin to adherens junctions together with E-cadherin and the inhibition of β-catenin signaling. This further reduces Slug expression and relieves the inhibition on E-cadherin transcription resulting in elevated E-cadherin expression.

Similar articles

Cited by

References

    1. Barker, N., and H. Clevers. 2001. Tumor environment: a potent driving force in colorectal cancer. Trends Mol. Med. 7:535–537. - PubMed
    1. Batlle, E., E. Sancho, C. Franci, D. Dominguez, M. Monfar, J. Baulida, and A. Garcia De Herreros. 2000. The transcription factor snail is a repressor of E-cadherin gene expression in epithelial tumour cells. Nat. Cell Biol. 2:84–89. - PubMed
    1. Batlle, E., J.T. Henderson, H. Beghtel, M.M. van den Born, E. Sancho, G. Huls, J. Meeldijk, J. Robertson, M. van de Wetering, T. Pawson, and H. Clevers. 2002. β-Catenin and TCF mediate cell positioning in the intestinal epithelium by controlling the expression of EphB/ephrinB. Cell. 111:251–263. - PubMed
    1. Behrens, J., U. Frixen, J. Schipper, M. Weidner, and W. Birchmeier. 1992. Cell adhesion in invasion and metastasis. Semin. Cell Biol. 3:169–178. - PubMed
    1. Ben-Ze'ev, A., and B. Geiger. 1998. Differential molecular interactions of β-catenin and plakoglobin in adhesion, signaling and cancer. Curr. Opin. Cell Biol. 10:629–639. - PubMed

Publication types

MeSH terms