. 2003 Nov 17;198(10):1527-37.
doi: 10.1084/jem.20030966.

Physiological beta cell death triggers priming of self-reactive T cells by dendritic cells in a type-1 diabetes model

Affiliations

Physiological beta cell death triggers priming of self-reactive T cells by dendritic cells in a type-1 diabetes model

Shannon Turley et al. J Exp Med. .

Abstract

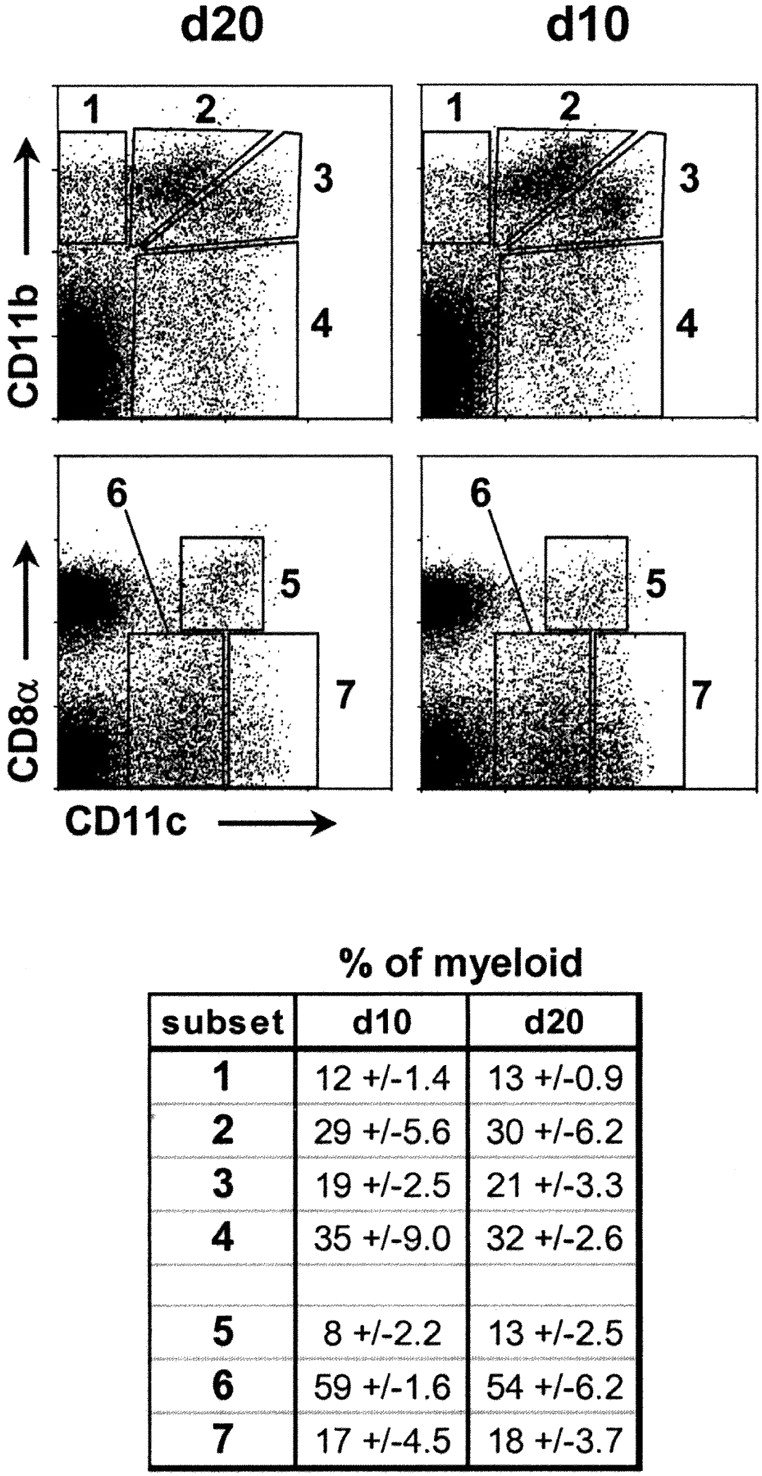
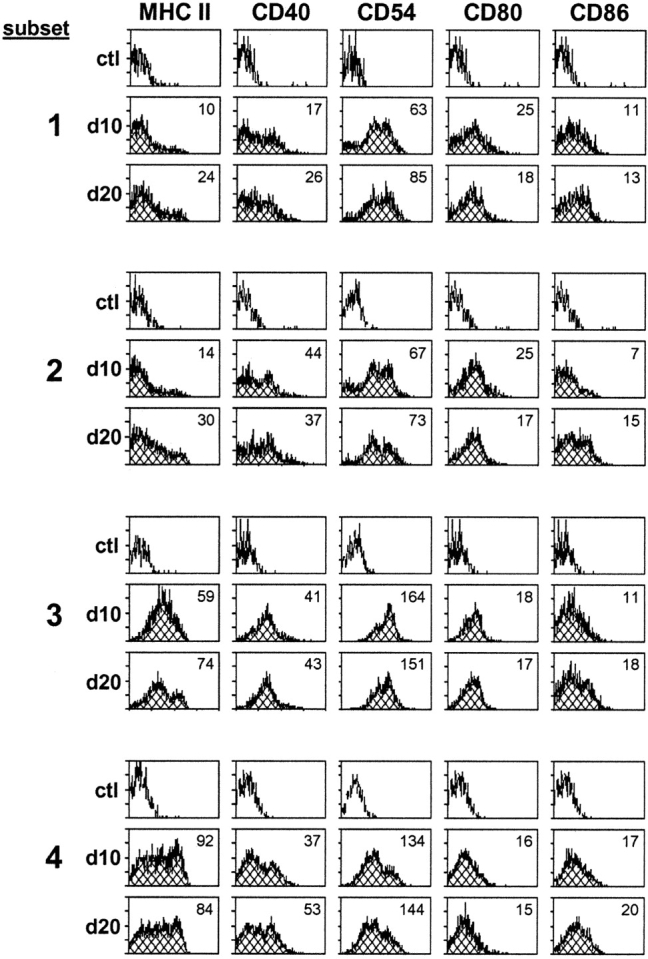
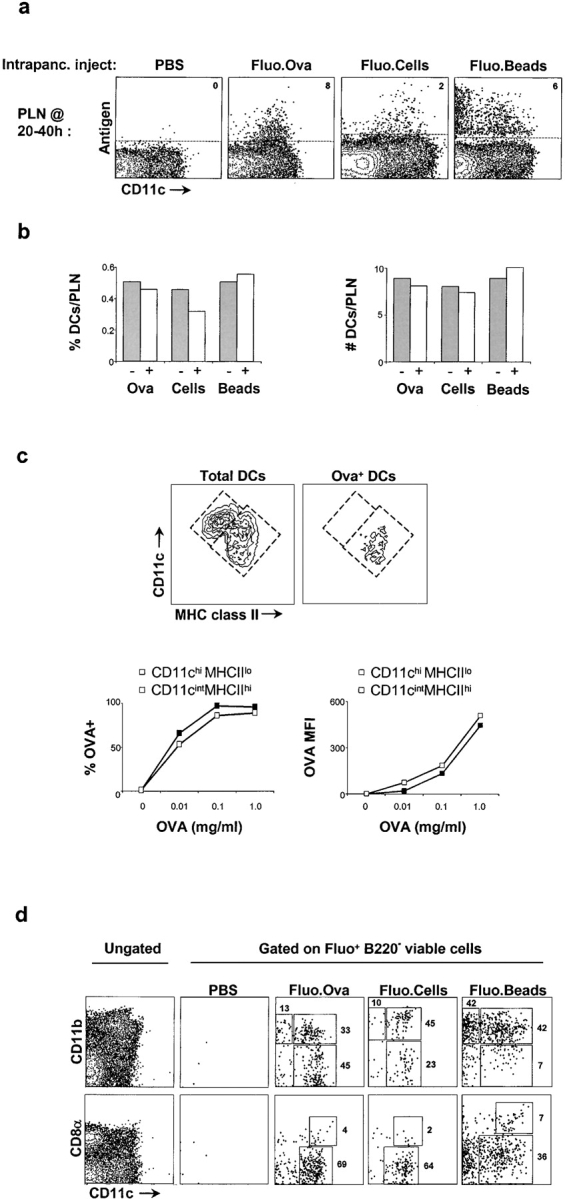
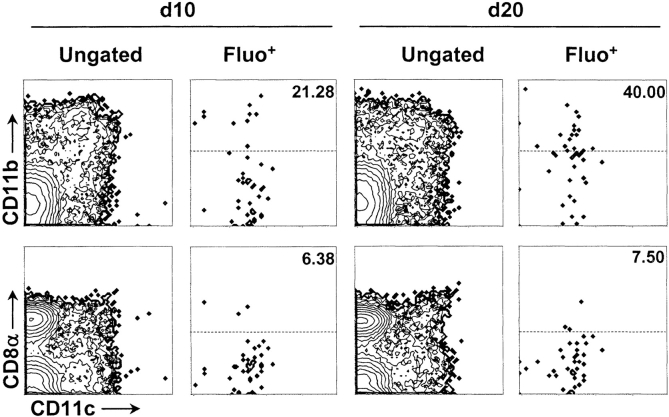
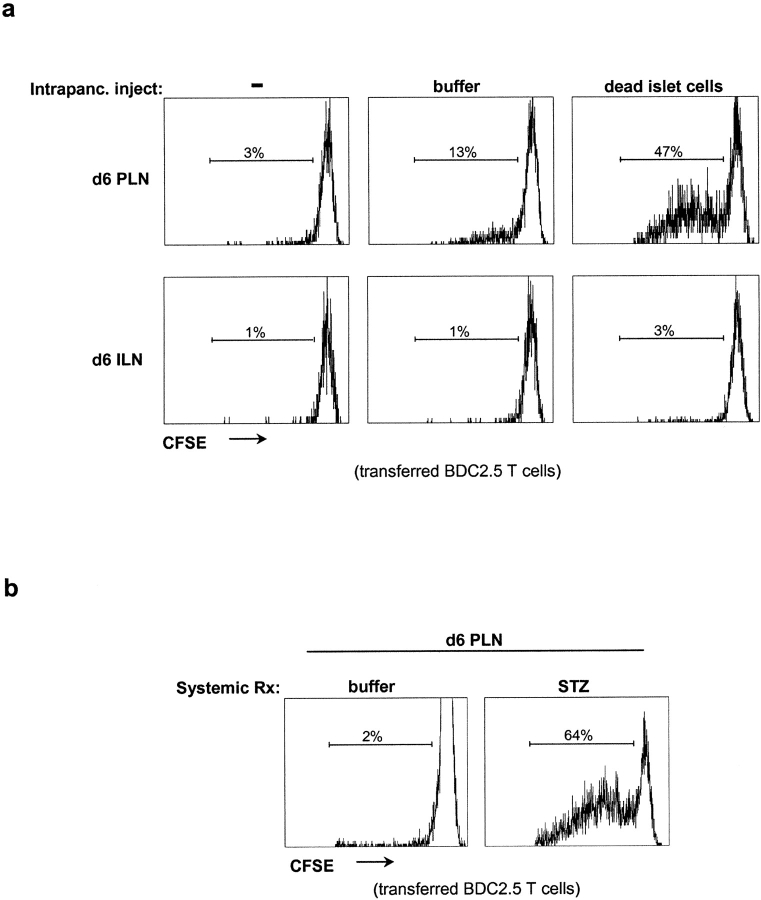
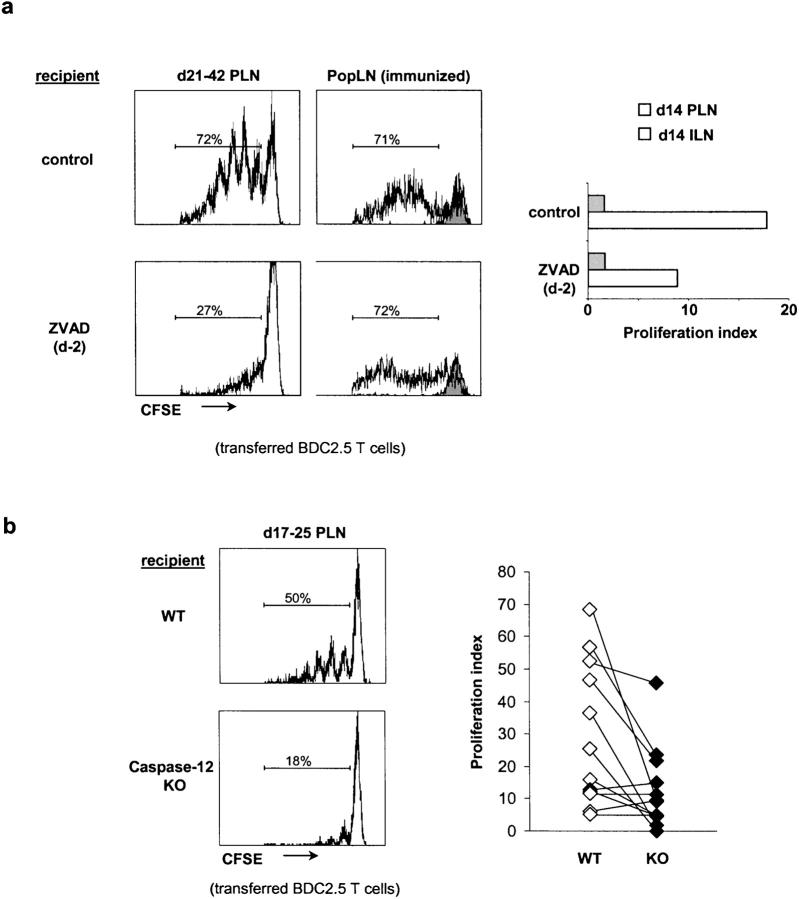
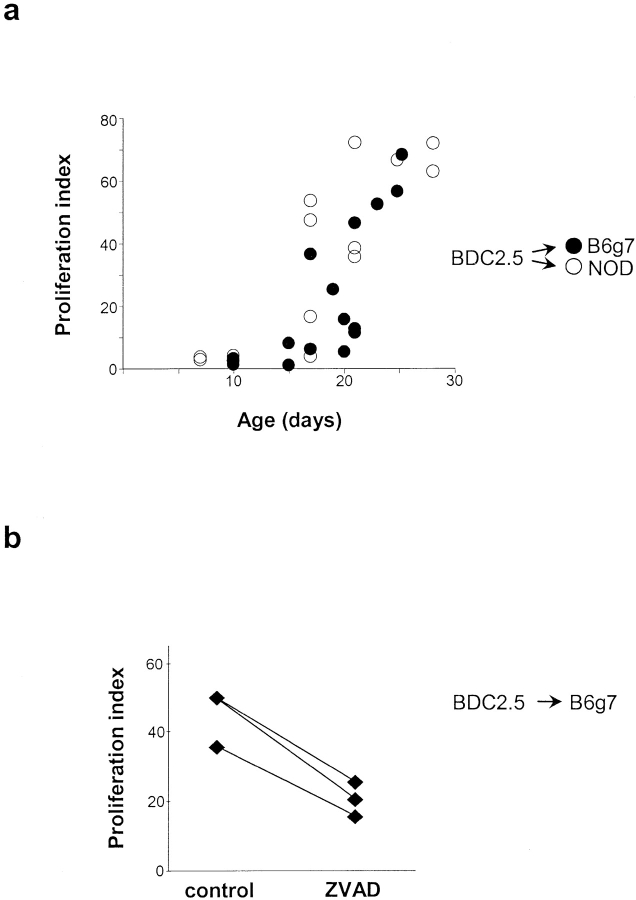
The prelude to type-1 diabetes is leukocyte infiltration into the pancreatic islets, or insulitis. This process begins in pancreatic lymph nodes when T lymphocytes reactive to islet beta cells encounter antigen-presenting cells (APCs) displaying peptides derived from beta cell proteins. We show here that a ripple of physiological beta cell death, which occurs at 2 wk of age in all mouse strains, precipitates the arrival of such APCs, and that the relevant APC is a dendritic cell of CD11c+CD11b+CD8alpha- phenotype. These findings have significant implications concerning the nature of the diabetes-provoking deficits in NOD mice, the identity of the primordial diabetogenic antigens, and our understanding of the balance between immunity and tolerance in a pathological context.


Figures

Figure 1.
Figure 1.
Composition of PLN DCs at days 10 (d10) and 20 (d20). DC subsets in PLNs of 10- and 20-d-old NOD mice were stained with CD11c (x axis) and CD11b or CD8α (y axis). Dotplots (gated on B220HO) are representative of results from >15 experiments. Values in table indicate the proportion of each subset expressed as the percentage of total myeloid (CD11b+CD11c+) cells (average ± SD of three independent experiments).
Figure 2.
Figure 2.
Expression of maturation markers by PLN DCs at days 10 (d10) and 20 (d20). Surface expression of MHC class II, CD40, CD54, CD80, and CD86 molecules compared on subsets 1–4 described in Fig. 1 from PLNs of 10- and 20-d-old NOD mice. Isotype controls are shown for each subset. Value in top right corner of each histogram indicates mean fluorescence intensity of specified marker. Histograms represent results of 4–10 experiments.
Figure 3.
Figure 3.
Transport of pancreatic antigens to draining LNs. (a) Flow cytometric assessment of antigen transport to PLN after intrapancreatic injection of PBS, Fluo.Ova, Fluo.Cells, or Fluo.Beads into ∼20-d-old NOD mice. Antigen-bearing cells (Fluo+) are plotted versus CD11c+ cells. PLNs were harvested ∼20 h after Fluo.Ova administration and ∼40 h after administration of Fluo.Cells or Fluo.Beads. Value shown in top right corner of the dotplots is the percentage of antigen-bearing cells (Fluo+) among CD11c+ cells. (b) Quantification of DCs in 4-wk-old PLNs before and after administration of Fluo.Ova, Fluo.Cells, and Fluo.Beads. The relative abundance (left) and absolute number (right) of DCs (CD11c+ cells) per PLN are shown. (c) Characterization of antigen capture by distinct DC subsets in vivo and in vitro. Cell suspensions from PLNs were stained with CD11c (y axis) and MHC class II (x axis). Left contour plot depicts total DCs in the PLNs, whereas right contour plot depicts Fluo.Ova+ DCs in PLN after intrapancreatic injection. Fluo.Ova was associated with CD11cintMHCIIhi DCs but not CD11chiMHCIIlo DCs in vivo. The line graphs depict the in vitro endocytic capacity of CD11chiMHCIIlo (open squares) and CD11cintMHCIIhi (closed squares) DC populations. The fraction of Fluo.Ova+ cells within and the amount of antigen captured by each DC population were similar. (d) Phenotypic characterization of antigen-bearing (Fluo+) cells in 4-wk-old NOD PLNs. The leftmost panel represents total PLN cells (no Fluo or FL1 gate) after a mock intrapancreatic injection. The other dotplots display antigen-bearing (Fluo+) cells in PLNs after intrapancreatic injection of specified antigen. Values in dotplots depict the percentage of antigen-bearing cells (Fluo+) within the individual gates. Data are representative of four to six experiments.
Figure 4.
Figure 4.
Antigen transport by day 10 (d10) pancreatic DCs. Flow cytometric analysis of antigen-bearing cells (Fluo+) in ∼10- and 20-d-old NOD mice 40 h after intrapancreatic injection of Fluo.Cells into NOD mice. Total PLN cells are shown in the left column and antigen-bearing (Fluo+) cells in the right column for both ages. The values in top right corner of dot plot indicate the percentage of Fluo+ DCs expressing CD11b (top plots) or CD8α (bottom plots) in gate above dotted line. Data are representative of two to four experiments.
Figure 5.
Figure 5.
The presence of dead β cells provokes activation of naive BDC2.5 T cells in neonatal PLNs. (a) Activation of transferred naive BDC2.5 T cells (gated on CD4+Vβ4+ cells) in PLNs and ILNs after intrapancreatic implantation of dead islets or buffer into 6-d-old NOD mice. Proliferation was assessed in all experiments ∼66 h after transfer by CFSE dilution in CD4+ T cells. (b) Activation of transferred naive BDC2.5 T cells (gated on CD4+Vβ4+ cells) in PLNs after intraperitoneal injection of STZ into 6-d-old NOD mice.
Figure 6.
Figure 6.
β cell death is required for optimum BDC2.5 T cell priming. (a) Effect of systemic ZVAD treatment on naive BDC2.5 T cell activation in PLNs of 14–42-d-old NOD mice. The left histograms depict BDC2.5 T cell proliferation, assessed by CFSE dilution in CD4+Vβ4+ cells, in the PLNs of 21–42-d-old mice after ZVAD treatment (administered at day 2). BDC2.5 T cell activation was impaired by 40% on average (P < 0.0001). The histograms in right column display T cell proliferation in popliteal LNs of ZVAD-treated NOD mice after footpad immunization with BDC2.5 peptide mimic. BDC2.5 T cells do not proliferate in popliteal LNs of unimmunized recipients (shaded histogram). Bar graph depicts BDC2.5 T cell proliferation in the PLNs or ILNs of 14-d-old after ZVAD treatment at day 2. (b) BDC2.5 T cell activation in PLNs of caspase-12–deficient B6.H2g7/g7 mice (KO) and wild-type littermate controls (WT). Proliferation of transferred naive BDC2.5 T cells, assessed by CFSE dilution in CD4+Vβ4+ cells, was reduced by 56% on average in KO recipients (P = 0.006). Graph on right shows the proliferation indices for naive wild-type BDC2.5 T cells after transfer into 17–25-d-old caspase-12 KO mice or wild-type littermates on the B6.H2g7/g7 background. Each symbol represents an individual mouse.
Figure 7.
Figure 7.
Regulation of autoreactive T cell priming not determined by NOD background. (a) Naive BDC2.5 T cell activation was assessed in PLNs of NOD and B6.H2g7/g7 mice at different ages ranging from 7 to 28 d of age. CFSE dilution in BDC2.5 T cells (gated on CD4+Vβ4+ cells) was measured in all recipients ∼66 h after transfer. (b) Effect of systemic ZVAD treatment on naive BDC2.5 T cell activation (measured by CFSE dilution in CD4+Vβ4+ cells) in PLNs of 21-d-old B6.H2g7/g7 recipients. Systemic ZVAD treatment caused a 50% decrease in proliferation of BDC2.5 T cells in PLNs of B6.H2g7/g7 mice.

References

    1. Tisch, R., and H. McDevitt. 1996. Insulin-dependent diabetes mellitus. Cell. 85:291–297. - PubMed
    1. Jenkins, M.K., A. Khoruts, E. Ingulli, D.L. Mueller, S.J. McSorley, R.L. Reinhardt, A. Itano, and K.A. Pape. 2001. In vivo activation of antigen-specific CD4 T cells. Annu. Rev. Immunol. 19:23–45. - PubMed
    1. Hoglund, P., J. Mintern, C. Waltzinger, W. Heath, C. Benoist, and D. Mathis. 1999. Initiation of autoimmune diabetes by developmentally regulated presentation of islet cell antigens in the pancreatic lymph nodes. J. Exp. Med. 189:331–339. - PMC - PubMed
    1. Gagnerault, M.C., J.J. Luan, C. Lotton, and F. Lepault. 2002. Pancreatic lymph nodes are required for priming of β cell reactive T cells in NOD mice. J. Exp. Med. 196:369–377. - PMC - PubMed
    1. Katz, J.D., B. Wang, K. Haskins, C. Benoist, and D. Mathis. 1993. Following a diabetogenic T cell from genesis through pathogenesis. Cell. 74:1089–1100. - PubMed

Publication types