. 2003 Nov 17;198(10):1583-93.
doi: 10.1084/jem.20031051.

Memory CD8+ T cells provide innate immune protection against Listeria monocytogenes in the absence of cognate antigen

Affiliations

Memory CD8+ T cells provide innate immune protection against Listeria monocytogenes in the absence of cognate antigen

Rance E Berg et al. J Exp Med. .

Abstract

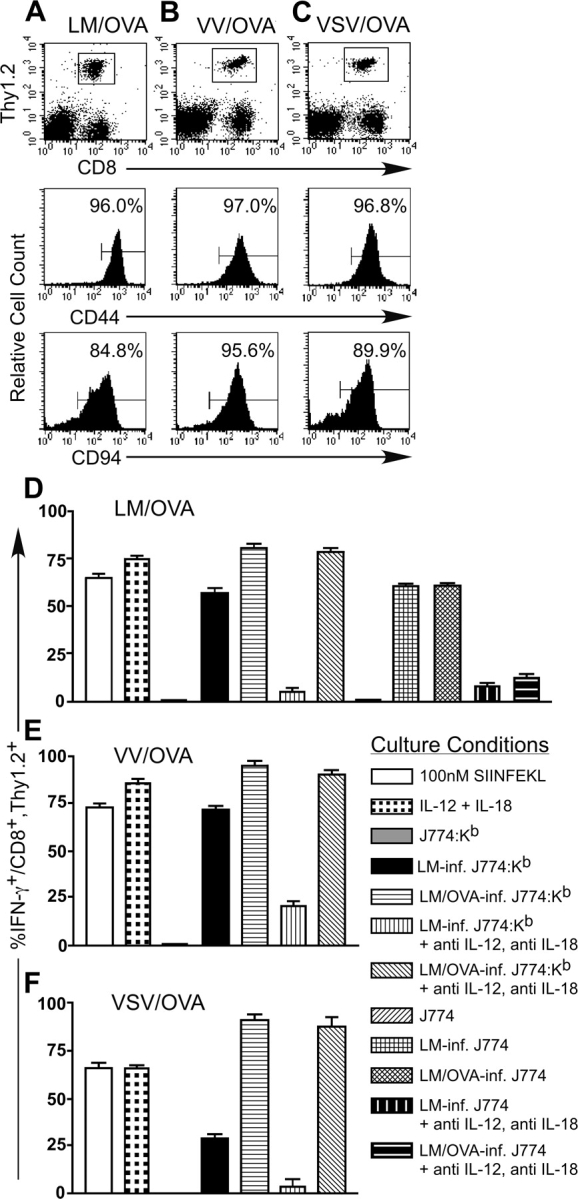
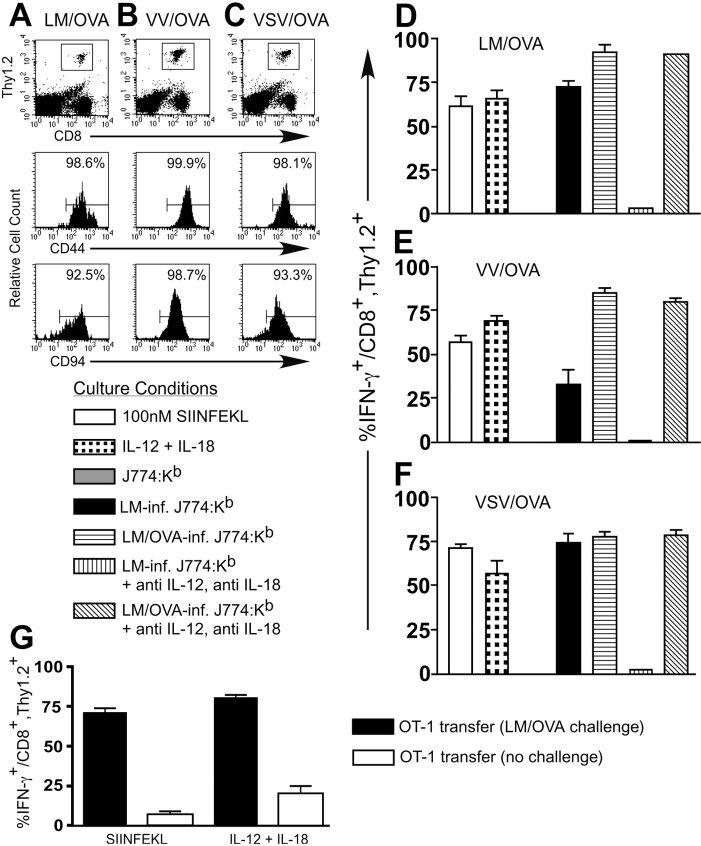
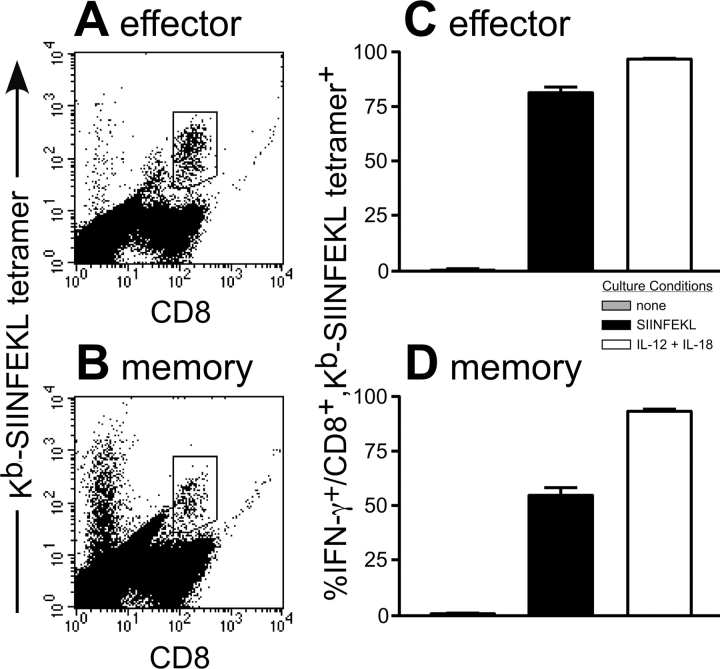
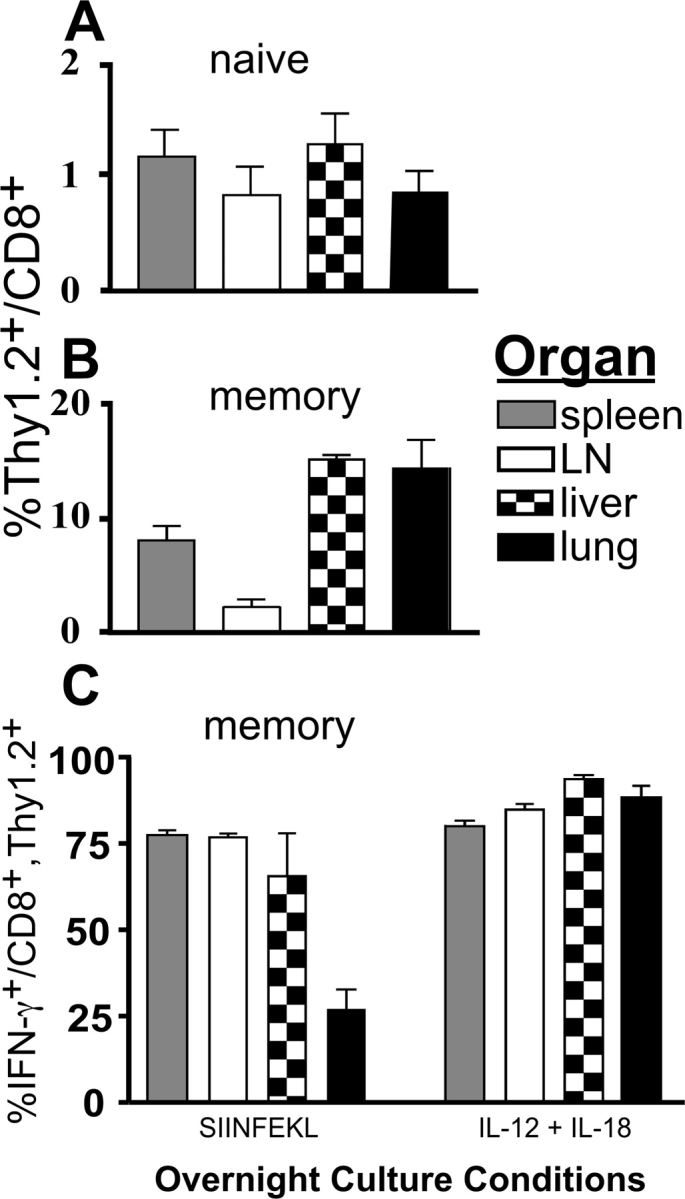
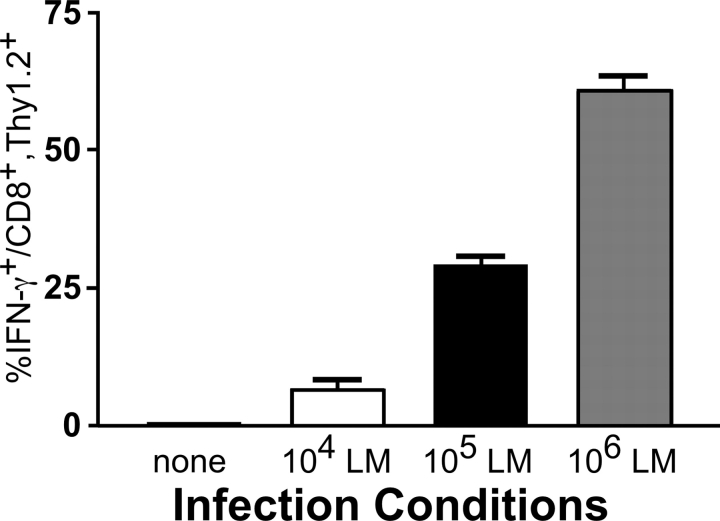
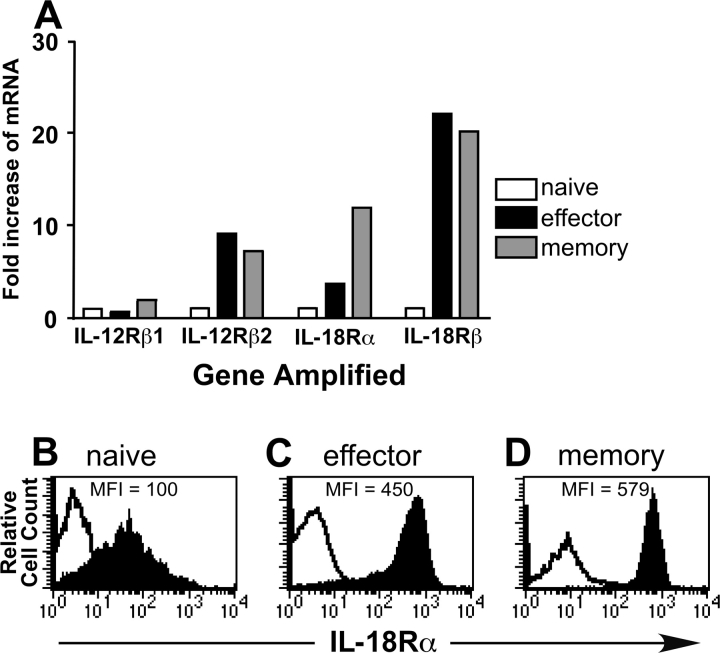
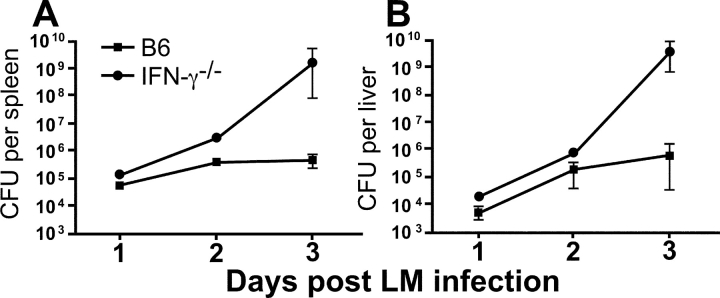
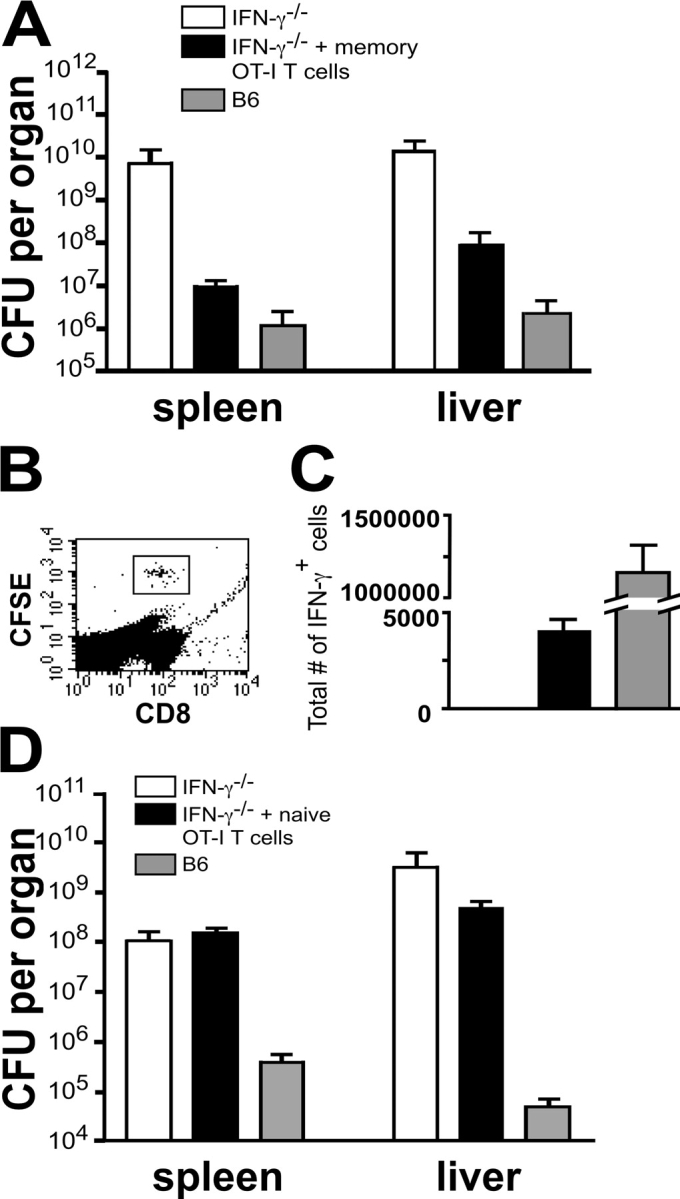
Interferon (IFN)-gamma plays an important role in the innate immune response against intracellular bacterial pathogens. It is commonly thought that natural killer cells are the primary source of this cytokine that is involved in activating antibacterial effects in infected cells and polarizing CD4+ T cells toward the Th1 subset. However, here we show that both effector and memory CD8+ T cells have the potential to secrete IFN-gamma in response to interleukin (IL)-12 and IL-18 in the absence of cognate antigen. We demonstrate that memory CD8+ T cells specific for the ovalbumin protein secrete IFN-gamma rapidly after infection with wild-type Listeria monocytogenes (LM). Furthermore, small numbers of ovalbumin-specific, memory CD8+ T cells can reduce spleen and liver bacterial counts in IFN-gamma-deficient mice 3 d after LM infection. Up-regulation of the receptors for IL-12 and IL-18 provides a mechanism for the ability of memory CD8+ T cells to respond in this antigen nonspecific manner. Thus, CD8+ T cells play an important role in the innate immune response against intracellular pathogens by rapidly secreting IFN-gamma in response to IL-12 and IL-18.


Figures

Figure 1.
Figure 1.
Effector OT-I T cells secrete IFN-γ in response to TCR stimulation or a combination of IL-12 and IL-18 in vitro. 3 × 10⁶ nylon wool-purified OT-I splenocytes were transferred into B6.Thy1.1 mice that were then infected with ∼2,000 LM/OVA (A), 2 × 10⁶ PFU VV/OVA (B), or 2 × 10⁶ PFU VSV/OVA (C). 7 d after infection, the mice were killed and splenocytes were stained to identify the OT-I T cells and their activation/memory status. After gating on the CD8+, Thy1.2+ population of OT-I T cells, the histograms indicate the percentage of cells positive for CD44 or CD94. Bulk splenocytes from the LM/OVA (D), VV/OVA (E), or VSV/OVA (F) effector mice were incubated overnight with the indicated culture conditions. GolgiPlug™ was added for the final 4 h of culture, and the cells were subsequently harvested and stained for expression of CD8, Thy1.2, and intracellular IFN-γ. The data are the average of two mice and are representative of at least two independent experiments.
Figure 2.
Figure 2.
Memory OT-I T cells secrete IFN-γ in response to TCR stimulation or a combination of IL-12 and IL-18 in vitro. 3 × 10⁶ nylon wool-purified OT-I splenocytes were transferred into B6.Thy1.1 mice that were then infected with ∼2,000 LM/OVA (A), 2 × 10⁶ PFU VV/OVA (B), or 2 × 10⁶ PFU VSV/OVA (C). The mice were then allowed to rest for >4 wk in order to generate stable memory populations of OT-I T cells. The mice were killed, and splenocytes were stained to identify the OT-I T cells and their activation/memory status. After gating on the CD8+, Thy1.2+ population of OT-I T cells, the histograms indicate the percentage of cells positive for CD44 or CD94. Bulk splenocytes from the LM/OVA (D), VV/OVA (E), or VSV/OVA (F) memory mice were incubated overnight with the indicated culture conditions. GolgiPlug™ was added for the final 4 h of culture, and the cells were subsequently harvested and stained for expression of CD8, Thy1.2, and intracellular IFN-γ. The results shown are the average of two mice and are representative of at least two independent experiments. (G) OT-I T cells that were transferred into B6.Thy1.1 mice and not challenged were compared with similar mice that were challenged with LM/OVA and then rested for >4 wk. After overnight stimulation with 10 nM SIINFEKL or a combination of IL-12 and IL-18, the cells were stained for CD8, Thy1.2, and intracellular IFN-γ. The results from two mice per group were averaged, and the experiment was performed three times with similar results.
Figure 3.
Figure 3.
Endogenous effector and memory OVA-specific T cells secrete IFN-γ in response to TCR stimulation or a combination of IL-12 and IL-18 in vitro. (A and C) B6 mice were primed with LM/OVA and killed 7 d later. Bulk splenocytes from these mice were incubated overnight with the indicated culture conditions. GolgiPlug™ was added for the final 4 h of culture, and the cells were stained with the Kb-SIINFEKL tetramer and for CD8 and intracellular IFN-γ. (B and D) B6 mice were primed with LM/OVA and killed >4 wk later. Splenocytes were cultured and stained as in A and C. For each dot plot, one overnight culture with IL-12 and IL-18 is shown out of six representative mice. The results in C and D are the average of three mice for each group and were repeated with similar results.
Figure 4.
Figure 4.
Memory OT-I T cells preferentially relocate to peripheral organs and respond to IL-12 and IL-18 by secreting IFN-γ. (A) 107 nylon wool-purified OT-I splenocytes were transferred into B6.Thy1.1 hosts. (B and C) 3 × 10⁶ nylon wool-purified OT-I T cells were transferred into B6.Thy1.1 hosts, challenged with ∼2,000 LM/OVA, and then rested for >4 wk. Graphs representing the percentage of Thy1.2+ (OT-I) cells out of the total CD8+ population within the indicated organs for the naive OT-I T cells (A) and the memory OT-I T cells (B) are shown. (C) After overnight stimulation with either 10 nM SIINFEKL or a combination of IL-12 and IL-18, the cells isolated from the indicated organs were incubated for 4 h with GolgiPlug™ and then stained for CD8, Thy1.2, and intracellular IFN-γ. Three mice were averaged per group, and the data are representative of three independent experiments.
Figure 5.
Figure 5.
Memory OT-I T cells primed with VSV/OVA respond to an infection with WT LM by secreting IFN-γ. 3 × 10⁶ nylon wool-purified OT-I splenocytes were transferred into B6.Thy1.1 hosts. The mice were then challenged with 2 × 10⁶ PFU VSV/OVA and rested for >4 wk to generate stable memory populations of OT-I T cells. The mice were rechallenged with varying doses of WT LM. 16 h after infection, the mice were killed and the splenocytes were cultured for 3 h in RPMI media containing GolgiPlug™ (no cytokines or antigens were added). The cells were subsequently harvested and stained for CD8, Thy1.2, and intracellular IFN-γ. The results shown are the average of two mice. Similar results were obtained using B6.Thy1.1 mice that were OT-I transferred, primed with VV/OVA, rested for >4 wk and rechallenged with WT LM.
Figure 6.
Figure 6.
Effector and memory OT-I T cells up-regulate IL-12Rβ2, IL-18Rα, and IL-18Rβ. (A) Naive, effector, and memory OT-I T cells were purified as described in Materials and Methods. mRNA was then purified, cDNA generated, and real-time RT-PCR performed. The results were normalized to GAPDH levels to control for quantity of cDNA in each sample. The levels of each of the receptors was set to a value of one for the naive OT-I population, and the results are presented as fold increase of mRNA over the naive OT-I population. Each reaction was performed in triplicate, and the data are the average of the triplicate. Levels of the IL-18Rα subunit were measured on populations of naive OT-I T cells (B), effector OT-I T cells (C), and memory OT-I T cells (D). For the naive population, Vα2+, CD8+ splenocytes from naive OT-I mice were gated on for the analysis of the IL-18Rα subunit. For the effector population, nylon wool-purified OT-I splenocytes were transferred into B6.Thy1.1 hosts, which were then challenged with ∼2,000 LM/OVA. 7 d postinfection, splenocytes were stained, and the CD8+, Thy1.2+ population of OT-I T cells was gated on for analysis of the IL-18Rα subunit. The memory population was generated in the same manner as the effector population, except the mice were rested for >4 wk before analysis. The open histograms represent background staining in the absence of the primary antibody, whereas the filled histograms represent staining in the presence of the primary antibody. Each histogram is staining from one representative of four mice.
Figure 7.
Figure 7.
Innate susceptibility of B6 and IFN-γ2/2 mice to LM infection. B6 and IFN-γ−/− mice were infected with ∼104 LM. At days 1, 2, and 3 postinfection, the mice were killed and spleen (A) and liver (B) LM counts were determined by plating 10-fold dilutions of the homogenized organs on BHI plates. Three mice per group were averaged for days 1 and 2, whereas eight mice per group were averaged for day 3. Similar results were obtained in independent experiments performed on days 1, 2, and 4 postinfection.
Figure 8.
Figure 8.
Memory OT-I T cells protect IFN-γ2/2 mice from a WT LM infection. 3 × 10⁶ nylon wool-purified OT-I splenocytes were transferred into B6.Thy1.1 mice and then challenged with 2 × 10⁶ PFU VV/OVA. The mice were then rested for >4 wk, killed, and the splenocytes were sorted for CD8+, Thy1.2+ OT-I T cells. 5 × 10⁵ CFSE labeled memory OT-I T cells were injected into IFN-γ−/− recipients. (A) B6, IFN-γ−/−, and IFN-γ−/− mice transferred with memory OT-I T cells were then infected with ∼104 WT LM and killed 3 d later to determine spleen and liver LM counts. (B and C) Splenocytes from the above mice were cultured for 3 h in media containing GolgiPlug™ and then analyzed for CFSE, CD8, and intracellular IFN-γ expression. The number of IFN-γ–secreting OT-I T cells was calculated by multiplying the total number of splenocytes isolated from the infected mice by the percentage of CFSE-labeled, CD8+, IFN-γ+ cells determined by flow cytometry. The number of IFN-γ–secreting cells in the B6 mice was calculated by multiplying the total number of splenocytes isolated from the infected mice by the percentage of IFN-γ–secreting cells determined by flow cytometry. (D) Naive OT-I T cells were sorted for CD8+, Vα2+, and CD44lo expression. 5 × 10⁵ CFSE-labeled naive OT-I T cells were injected into IFN-γ−/− recipients. B6, IFN-γ−/−, and IFN-γ−/− mice transferred with naive OT-I T cells were then infected with ∼104 WT LM and killed 3 d later to determine spleen and liver LM counts. The data shown are the average of three mice per group for A–C and two mice per group for D. Each experiment is one representative of two.

References

    1. Portnoy, D.A. 1992. Innate immunity to a facultative intracellular bacterial pathogen. Curr. Opin. Immunol. 4:20–24. - PubMed
    1. Unanue, E.R. 1997. Studies in listeriosis show the strong symbiosis between the innate cellular system and the T-cell response. Immunol. Rev. 158:11–25. - PubMed
    1. Mombaerts, P., J. Arnoldi, F. Russ, S. Tonegawa, and S.H. Kaufmann. 1993. Different roles of alpha beta and gamma delta T cells in immunity against an intracellular bacterial pathogen. Nature. 365:53–56. - PubMed
    1. MacMicking, J.D., C. Nathan, G. Hom, N. Chartrain, D.S. Fletcher, M. Trumbauer, K. Stevens, Q.W. Xie, K. Sokol, N. Hutchinson, et al. 1995. Altered responses to bacterial-infection and endotoxic-shock in mice lacking inducible nitric-oxide synthase. Cell. 81:641–650. - PubMed
    1. Beckerman, K.P., H.W. Rogers, J.A. Corbett, R.D. Schreiber, M.L. McDaniel, and E.R. Unanue. 1993. Release of nitric oxide during the T cell-independent pathway of macrophage activation. Its role in resistance to Listeria monocytogenes. J. Immunol. 150:888–895. - PubMed

Publication types

MeSH terms