. 2003 Dec;112(11):1678-87.
doi: 10.1172/JCI18945. Epub 2003 Nov 17.

Hepatoprotection by the farnesoid X receptor agonist GW4064 in rat models of intra- and extrahepatic cholestasis

Affiliations

Hepatoprotection by the farnesoid X receptor agonist GW4064 in rat models of intra- and extrahepatic cholestasis

Yaping Liu et al. J Clin Invest. 2003 Dec.

Abstract

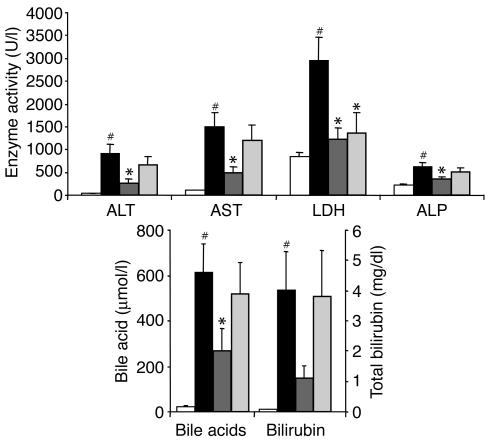
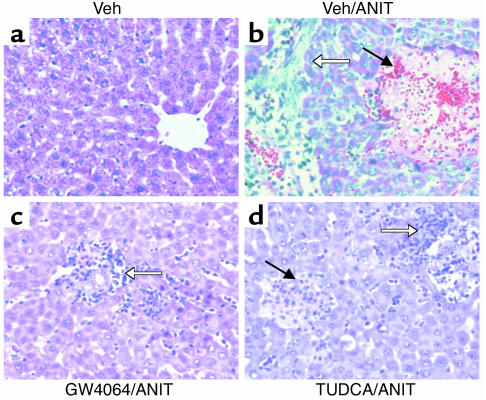
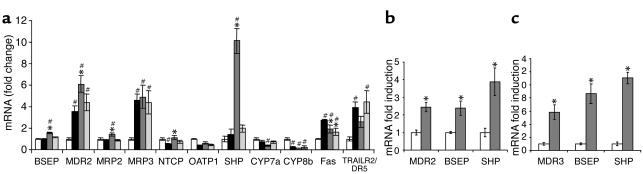
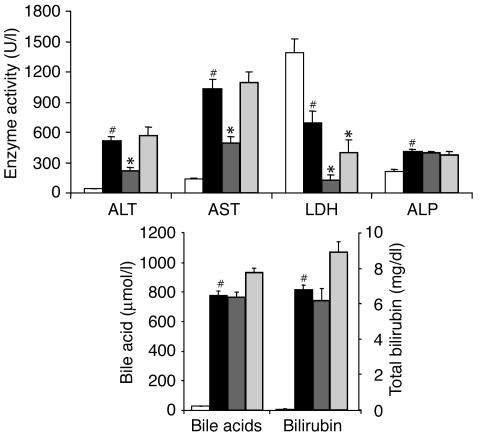
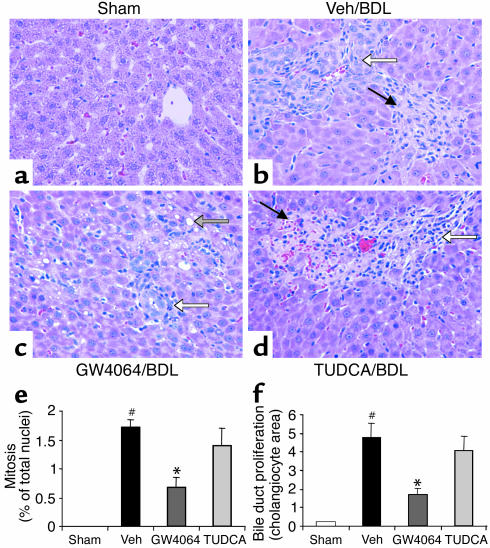
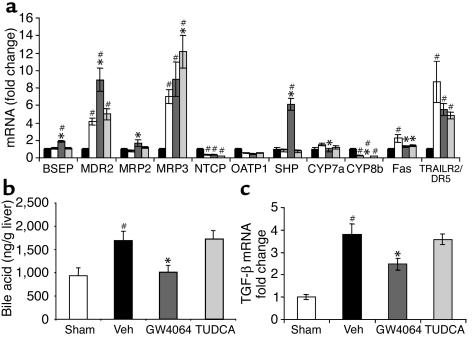
Farnesoid X receptor (FXR) is a bile acid-activated transcription factor that is a member of the nuclear hormone receptor superfamily. Fxr-null mice exhibit a phenotype similar to Byler disease, an inherited cholestatic liver disorder. In the liver, activation of FXR induces transcription of transporter genes involved in promoting bile acid clearance and represses genes involved in bile acid biosynthesis. We investigated whether the synthetic FXR agonist GW4064 could protect against cholestatic liver damage in rat models of extrahepatic and intrahepatic cholestasis. In the bile duct-ligation and alpha-naphthylisothiocyanate models of cholestasis, GW4064 treatment resulted in significant reductions in serum alanine aminotransferase, aspartate aminotransferase, and lactate dehydrogenase, as well as other markers of liver damage. Rats that received GW4064 treatment also had decreased incidence and extent of necrosis, decreased inflammatory cell infiltration, and decreased bile duct proliferation. Analysis of gene expression in livers from GW4064-treated cholestatic rats revealed decreased expression of bile acid biosynthetic genes and increased expression of genes involved in bile acid transport, including the phospholipid flippase MDR2. The hepatoprotection seen in these animal models by the synthetic FXR agonist suggests FXR agonists may be useful in the treatment of cholestatic liver disease.


Figures

Figure 1
Figure 1
Protection against ANIT-induced hepatotoxicity by GW4064. Rats (n = 6–8) were treated once daily with vehicle, GW4064, or TUDCA. On the second treatment day the rats received a single dose of ANIT or vehicle. Serum chemistries were measured 4 hours after the final dose. Values are presented as average ± SEM. White bars, vehicle/vehicle; black bars, vehicle/ANIT; dark gray bars, GW4064/ANIT; light gray bars, TUDCA/ANIT. Statistically significant differences between the vehicle/vehicle and vehicle/ANIT groups are indicated (#P < 0.05). Statistically significant differences between the vehicle/ANIT group and either the GW4064/ANIT or the TUDCA/ANIT groups are also indicated (*P < 0.05).
Figure 2
Figure 2
Protection against ANIT-induced necrosis by GW4064. Rats (n = 6–8) were treated once daily with vehicle (Veh), GW4064, or TUDCA. On the second treatment day the rats received a single dose of ANIT or vehicle. Livers were taken for histological analysis 4 hours after the final dose. The panels show representative H&E-stained liver sections from each treatment group at ×400 magnification. (a) Vehicle/vehicle–treated rat showing normal liver histology. (b) Vehicle/ANIT–treated rat showing a large area of parenchymal necrosis (filled arrow) with inflammatory cell infiltration (open arrow). (c) GW4064/ANIT–treated rat showing inflammatory cell infiltration (open arrow) around the bile duct, but no necrosis. (d) TUDCA/ANIT–treated rat showing parenchymal necrosis (filled arrow) with inflammatory cell infiltration (open arrow).
Figure 3
Figure 3
Liver gene expression profile in ANIT model of cholestasis. Total RNA was isolated from rat liver or primary human hepatocytes, and gene expression was measured using RTQ-PCR. (a) Gene expression profile in the liver of rats with ANIT-induced cholestasis. White bars, vehicle/vehicle; black bars, vehicle/ANIT; dark gray bars, GW4064/ANIT; light gray bars, TUDCA/ANIT. Statistically significant differences from the vehicle/vehicle group are indicated (#P < 0.05). Statistically significant differences from the vehicle/ANIT group are also indicated (*P < 0.05). (c) Induction of MDR2, BSEP, and SHP in the liver of the normal rat treated once daily for 4 days with corn oil vehicle (white bars) or GW4064, 30 mg/kg intraperitoneally (dark gray bars). Statistically significant inductions are indicated (*P < 0.05). (d) Induction of MDR3, BSEP, and SHP in primary human hepatocytes treated 12 hours with 0.1% DMSO as vehicle (white bars) or 1 μM GW4064 (dark gray bars). Statistically significant inductions are indicated (*P < 0.05).
Figure 4
Figure 4
Protection against bile duct ligation–induced hepatotoxicity by GW4064. Rats (n = 6) were subjected to bile duct ligation or laparotomy without bile duct ligation (sham-operated). Beginning 24 hours after bile duct ligation surgery, the rats were treated for 4 days with vehicle, GW4064, or TUDCA. Serum chemistries were measured 4 hours after the final dose. Values are presented as average ± SEM. White bars, sham; black bars, vehicle; dark gray bars, GW4064; light gray bars, TUDCA. Statistically significant differences between the sham-operated and vehicle/BDL groups are indicated (#P < 0.05). Statistically significant differences between the vehicle/BDL group and either the GW4064-treated or the TUDCA-treated groups are also indicated (*P < 0.05).
Figure 5
Figure 5
Protection against bile duct ligation–induced necrosis, mitosis, and bile duct proliferation by GW4064. Rats (n = 6) were subjected to bile duct ligation or laparotomy without bile duct ligation (sham-operated). Beginning 24 hours after bile duct ligation surgery, the rats were treated for 4 days with vehicle, GW4064, or TUDCA. Livers were taken for histological analysis 4 hours after the final dose. The panels show representative H&E-stained liver sections from each treatment group at ×400 magnification. (a) Sham-operated rats showing normal liver histology. (b) Vehicle-treated BDL rat showing bile duct proliferation (open arrow) and parenchymal necrosis (filled arrow) with inflammatory cell infiltration. (c) GW4064-treated BDL rat showing bile duct proliferation (white arrow) and fatty cell degeneration (shaded arrow). (d) TUDCA-treated BDL rat showing parenchymal necrosis (filled arrow) with inflammatory cell infiltration. (e) Mitotic nuclei were counted in samples from all rats. Mitosis was quantified by expressing the number of hepatocytes showing mitotic nuclei as a percentage of the total number of hepatocytes. White bars, sham; black bars, vehicle (Veh); dark gray bars, GW4064; light gray bars, TUDCA. Values are presented as average ± SEM. Statistically significant differences between the sham-operated and vehicle/BDL groups are indicated (#P < 0.05). Statistically significant differences between the vehicle/BDL group and either the GW4064-treated or the TUDCA-treated groups are also indicated (*P < 0.05). (f) Bile duct proliferation was quantified by measuring the area occupied by cholangiocytes in 40–50 randomly selected fields under ×400 magnification. Groups as in e; statistics as in e.
Figure 6
Figure 6
Liver gene expression profile in BDL model of cholestasis; liver bile acid concentration. (a) Gene expression profile in liver of rats with bile duct ligation–induced cholestasis. White bars, sham; black bars, vehicle; dark gray bars, GW4064; light gray bars, TUDCA. Statistically significant differences from sham-treated mice are indicated (#P < 0.05). Statistically significant differences from vehicle are also indicated (*P < 0.05). (b) Liver bile acid concentration in BDL rats. Bile acids were measured using API-LSMS. Groups as in a; statistics as in a. (c) TGF-β1 (TGF-β) expression in liver of rats with bile duct ligation–induced cholestasis. Groups as in a; statistics as in a.

Comment in

Similar articles

Cited by

References

    1. Bull LN, et al. A gene encoding a P-type ATPase mutated in two forms of hereditary cholestasis. Nat. Genet. 1998;18:219–224. - PubMed
    1. Strautnieks SS, et al. A gene encoding a liver-specific ABC transporter is mutated in progressive familial intrahepatic cholestasis. Nat. Genet. 1998;20:233–238. - PubMed
    1. de Vree JM, et al. Mutations in the MDR3 gene cause progressive familial intrahepatic cholestasis. Proc. Natl. Acad. Sci. U. S. A. 1998;95:282–287. - PMC - PubMed
    1. Smit JJ, et al. Homozygous disruption of the murine mdr2 P-glycoprotein gene leads to a complete absence of phospholipid from bile and to liver disease. Cell. 1993;75:451–462. - PubMed
    1. Paumgartner G, Beuers U. Ursodeoxycholic acid in cholestatic liver disease: mechanisms of action and therapeutic use revisited. Hepatology. 2002;36:525–531. - PubMed

MeSH terms

Substances