

Proteomic profiling of the NCI-60 cancer cell lines using new high-density reverse-phase lysate microarrays
- PMID: 14623978
- PMCID: PMC283574
- DOI: 10.1073/pnas.2331323100
Proteomic profiling of the NCI-60 cancer cell lines using new high-density reverse-phase lysate microarrays
Abstract
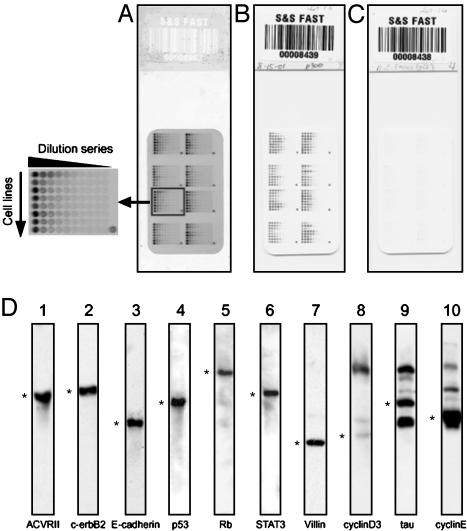
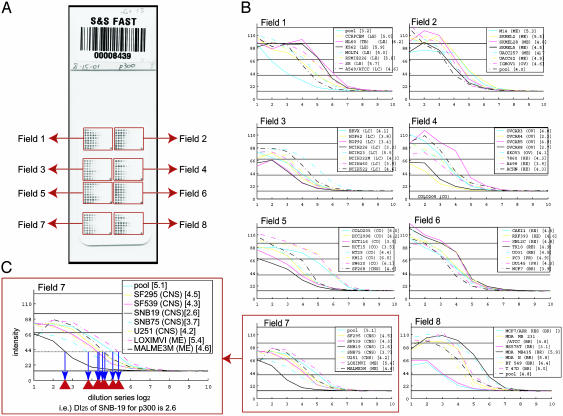
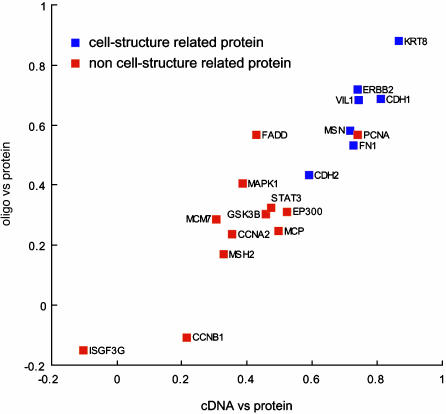
Because most potential molecular markers and targets are proteins, proteomic profiling is expected to yield more direct answers to functional and pharmacological questions than does transcriptional profiling. To aid in such studies, we have developed a protocol for making reverse-phase protein lysate microarrays with larger numbers of spots than previously feasible. Our first application of these arrays was to profiling of the 60 human cancer cell lines (NCI-60) used by the National Cancer Institute to screen compounds for anticancer activity. Each glass slide microarray included 648 lysate spots representing the NCI-60 cell lines plus controls, each at 10 two-fold serial dilutions to provide a wide dynamic range. Mouse monoclonal antibodies and the catalyzed signal amplification system were used for immunoquantitation. The signal levels from the >30,000 data points for our first 52 antibodies were analyzed by using p-scan and a quantitative dose interpolation method. Clustered image maps revealed biologically interpretable patterns of protein expression. Among the principal early findings from these arrays were two promising pathological markers for distinguishing colon from ovarian adenocarcinomas. When we compared the patterns of protein expression with those we had obtained for the same genes at the mRNA level by using both cDNA and oligonucleotide arrays, a striking regularity appeared: cell-structure-related proteins almost invariably showed a high correlation between mRNA and protein levels across the NCI-60 cell lines, whereas non-cell-structure-related proteins showed poor correlation.
Figures

References
-
- Knezevic, V., Leethanakul, C., Bichsel, V. E., Worth, J. M., Prabhu, V. V., Gutkind, J. S., Liotta, L. A., Munson, P. J., Petricoin, E. F., III, & Krizman, D. B. (2001) Proteomics 1, 1271–1278. - PubMed
-
- Paweletz, C. P., Charboneau, L., Bichsel, V. E., Simone, N. L., Chen, T., Gillespie, J. W., Emmert-Buck, M. R., Roth, M. J., Petricoin, E. F., III, & Liotta, L. A. (2001) Oncogene 20, 1981–1989. - PubMed
-
- Weinstein, J. N., Myers, T. G., O'Connor, P. M., Friend, S. H., Fornace, A. J., Jr., Kohn, K. W., Fojo, T., Bates, S. E., Rubinstein, L. V., Anderson, N. L., et al. (1997) Science 275, 343–349. - PubMed
Publication types
MeSH terms
Substances
LinkOut - more resources
Full Text Sources
Other Literature Sources
Molecular Biology Databases
