

A role for the exosome in the in vivo degradation of unstable mRNAs
- PMID: 14624005
- PMCID: PMC1370503
- DOI: 10.1261/rna.5940703
A role for the exosome in the in vivo degradation of unstable mRNAs
Abstract
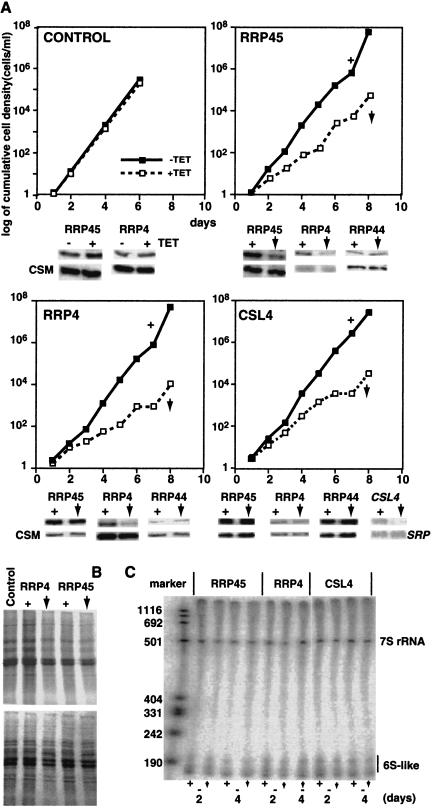
In mammals, the mRNAs encoding many proteins involved in inflammation bear destabilizing AU-rich elements (AREs) in the 3'-untranslated region. The exosome, a complex of 3' --> 5' exonucleases, is rate limiting in the destruction of such mRNAs in a mammalian in vitro system, but a role in vivo has not been demonstrated. The phenomenon of ARE-mediated degradation also occurs in the protist parasite Trypanosoma brucei. Messenger RNAs with 3'-untranslated region U-rich elements, which strongly resemble AREs, are extremely unstable in the trypanosome form that parasitizes mammals. The first step in degradation of these mRNAs in vivo is rapid destruction of the 3'-untranslated region; subsequently the mRNA is destroyed by exonucleases acting in both 5' --> 3' and 3' --> 5' directions. We here investigated the roles of three subunits of the trypanosome exosome complex, RRP45, RRP4, and CSL4, in this process, depleting the individual subunits in vivo by inducible RNA interference. RRP45 depletion, which probably disrupts exosome integrity, caused a delay in the onset of degradation of the very unstable RNAs, but did not affect degradation of more stable species. Depletion of RRP4 or CSL4 does not affect the stability of the residual exosome and did not change mRNA degradation kinetics. We conclude that the exosome is required for the initiation of rapid degradation of unstable mRNAs in trypanosomes.
Figures
Similar articles
-
The roles of 3'-exoribonucleases and the exosome in trypanosome mRNA degradation.RNA. 2013 Jul;19(7):937-47. doi: 10.1261/rna.038430.113. Epub 2013 May 22. RNA. 2013. PMID: 23697549 Free PMC article.
-
Degradation of the unstable EP1 mRNA in Trypanosoma brucei involves initial destruction of the 3'-untranslated region.Nucleic Acids Res. 2001 Nov 15;29(22):4707-15. doi: 10.1093/nar/29.22.4707. Nucleic Acids Res. 2001. PMID: 11713321 Free PMC article.
-
Expression of the human RNA-binding protein HuR in Trypanosoma brucei increases the abundance of mRNAs containing AU-rich regulatory elements.Nucleic Acids Res. 2002 Oct 15;30(20):4414-24. doi: 10.1093/nar/gkf577. Nucleic Acids Res. 2002. PMID: 12384588 Free PMC article.
-
Polycistronic trypanosome mRNAs are a target for the exosome.Mol Biochem Parasitol. 2016 Jan-Feb;205(1-2):1-5. doi: 10.1016/j.molbiopara.2016.02.009. Epub 2016 Mar 3. Mol Biochem Parasitol. 2016. PMID: 26946399 Free PMC article.
-
RNA-binding proteins and mRNA turnover in trypanosomes.Trends Parasitol. 2003 Apr;19(4):151-5. doi: 10.1016/s1471-4922(03)00035-7. Trends Parasitol. 2003. PMID: 12689640 Review.
Cited by
-
Rapid decay of unstable Leishmania mRNAs bearing a conserved retroposon signature 3'-UTR motif is initiated by a site-specific endonucleolytic cleavage without prior deadenylation.Nucleic Acids Res. 2010 Sep;38(17):5867-83. doi: 10.1093/nar/gkq349. Epub 2010 May 7. Nucleic Acids Res. 2010. PMID: 20453029 Free PMC article.
-
PolyA-specific ribonuclease (PARN-1) function in stage-specific mRNA turnover in Trypanosoma brucei.Eukaryot Cell. 2011 Sep;10(9):1230-40. doi: 10.1128/EC.05097-11. Epub 2011 Jul 8. Eukaryot Cell. 2011. PMID: 21743004 Free PMC article.
-
Roles of a Trypanosoma brucei 5'->3' exoribonuclease homolog in mRNA degradation.RNA. 2006 Dec;12(12):2171-86. doi: 10.1261/rna.291506. Epub 2006 Oct 31. RNA. 2006. PMID: 17077271 Free PMC article.
-
A role for Caf1 in mRNA deadenylation and decay in trypanosomes and human cells.Nucleic Acids Res. 2008 Jun;36(10):3374-88. doi: 10.1093/nar/gkn108. Epub 2008 Apr 27. Nucleic Acids Res. 2008. PMID: 18442996 Free PMC article.
-
Post-transcriptional reprogramming by thousands of mRNA untranslated regions in trypanosomes.Nat Commun. 2024 Sep 16;15(1):8113. doi: 10.1038/s41467-024-52432-0. Nat Commun. 2024. PMID: 39285175 Free PMC article.
References
-
- Beelman, C.A. and Parker, R. 1995. Degradation of mRNA in eukaryotes. Cell 81: 179–184. - PubMed
-
- Biebinger, S., Wirtz, L.E., and Clayton, C.E. 1997. Vectors for inducible over-expression of potentially toxic gene products in bloodstream and procyclic Trypanosoma brucei. Mol. Biochem. Parasitol. 85: 99–112. - PubMed
-
- Carballo, E., Lai, W.S., and Blackshear, P.J. 2000. Evidence that tristetraprolin is a physiological regulator of granulocyte-macrophage colony-stimulating factor messenger RNA deadenylation and stability. Blood 95: 1891–1899. - PubMed
Publication types
MeSH terms
Substances
LinkOut - more resources
Full Text Sources