

Proton MR spectroscopy of mitochondrial diseases: analysis of brain metabolic abnormalities and their possible diagnostic relevance
- PMID: 14625217
- PMCID: PMC8148915
Proton MR spectroscopy of mitochondrial diseases: analysis of brain metabolic abnormalities and their possible diagnostic relevance
Abstract
Background and purpose: Proton (hydrogen-1 [(1)H]) MR spectroscopy is a useful diagnostic tool in many metabolic diseases, but only scattered and inconclusive data are available on mitochondrial diseases. We performed MR imaging and (1)H MR spectroscopy of the brain in patients with different types of primary mitochondrial diseases to investigate the role of (1)H MR spectroscopy in the clinical evaluation of these disorders.
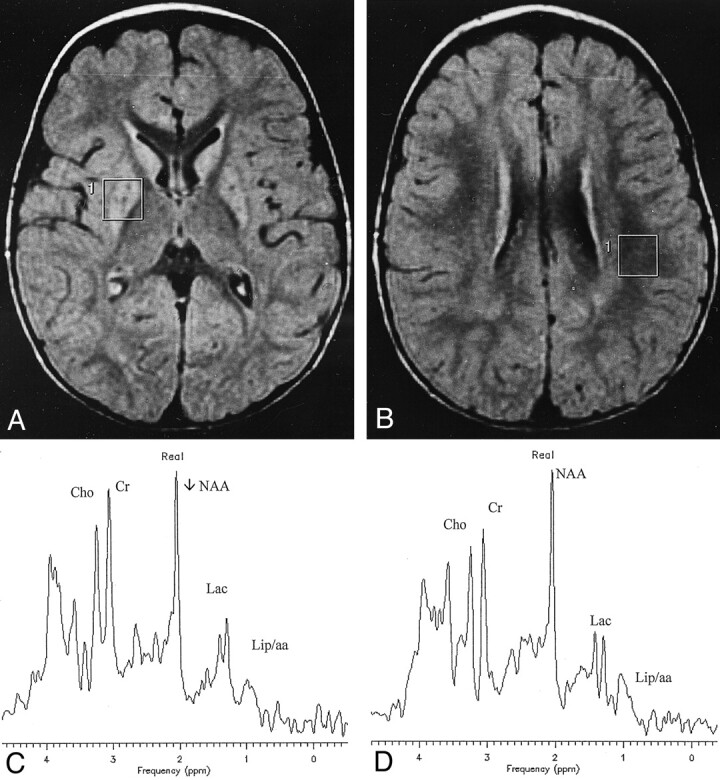
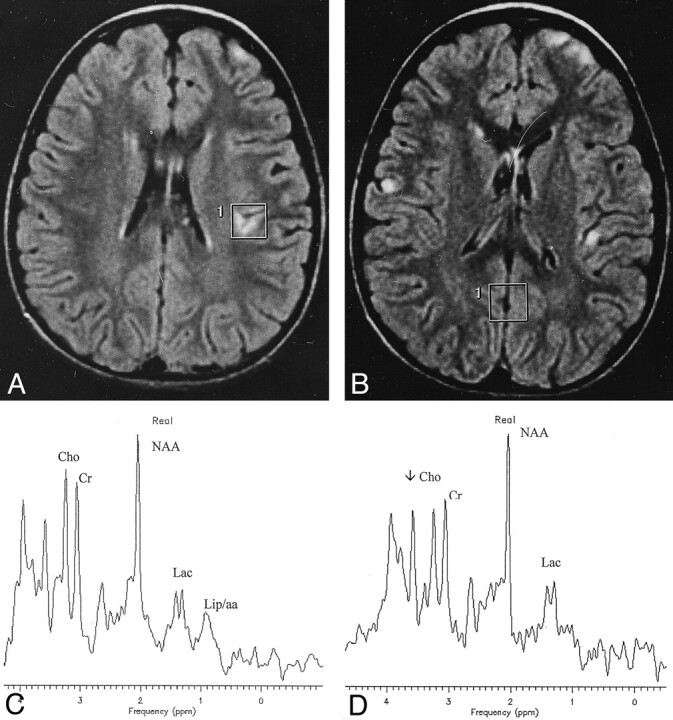
Methods: In 15 patients (11 adults, four children) with mitochondrial diseases, localized MR spectra were obtained at short TEs in cerebellar white matter, paratrigonal white matter, and parieto-occipital cortex that appeared normal on MR images. Additional spectra of basal ganglia and cortical gray matter structural lesions were obtained in three patients.
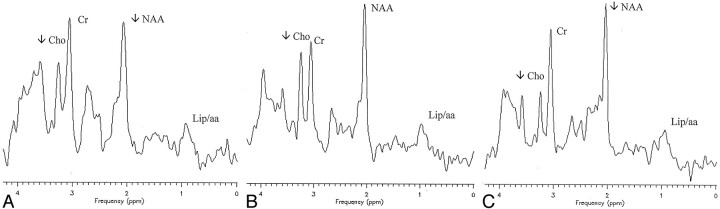
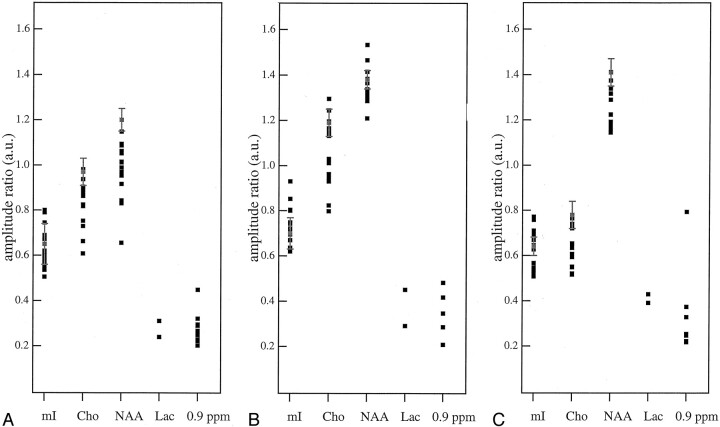
Results: A significant choline reduction and N-acetylaspartate reduction were found in areas that appeared normal on MR images. Lactate was never found in areas that appeared normal on MR images, except in two children in whom MR studies were performed during episodes of symptom exacerbation and revealed elevated lactate both in areas that appeared damaged on MR images and in normal-appearing areas. An additional abnormal signal at 0.9 ppm was found in a consistent number of studies.
Conclusion: (1)H MR spectroscopy proved to be a useful investigational tool for mitochondrial diseases, as it enabled detection of metabolic abnormalities even in areas of brain that appeared normal on MR images, especially when it was performed during episodes of clinical relapses or clinical exacerbation.
Figures
References
-
- Jackson MJ, Schaefer JA, Johnson MA, Morris AAM, Turnbull DM, Bindoff LA. Presentation and clinical investigation of mitochondrial respiratory chain disease: a study of 51 patients. Brain 1995;118:339–357 - PubMed
-
- Di Mauro S, Bonilla E, De Vivo DC. Does the patient have a mitochondrial encephalomyopathy? J Child Neurol 1999;14:23–35 - PubMed
-
- Moats RA, Watson L, Shonkt T, et al. Added value of automated clinical proton MR spectroscopy of the brain. J Comput Assist Tomogr 1995;19:480–491 - PubMed
-
- Wang ZJ, Zimmermann RA. Proton MR spectroscopy of pediatric brain metabolic disorders. Neuroimaging Clin North Am 1998;8:781–807 - PubMed
Publication types
MeSH terms
Substances
Grants and funding
LinkOut - more resources
Full Text Sources
Medical