

Optical measurements of presynaptic release in mutant zebrafish lacking postsynaptic receptors
- PMID: 14627630
- PMCID: PMC6740929
- DOI: 10.1523/JNEUROSCI.23-33-10467.2003
Optical measurements of presynaptic release in mutant zebrafish lacking postsynaptic receptors
Abstract
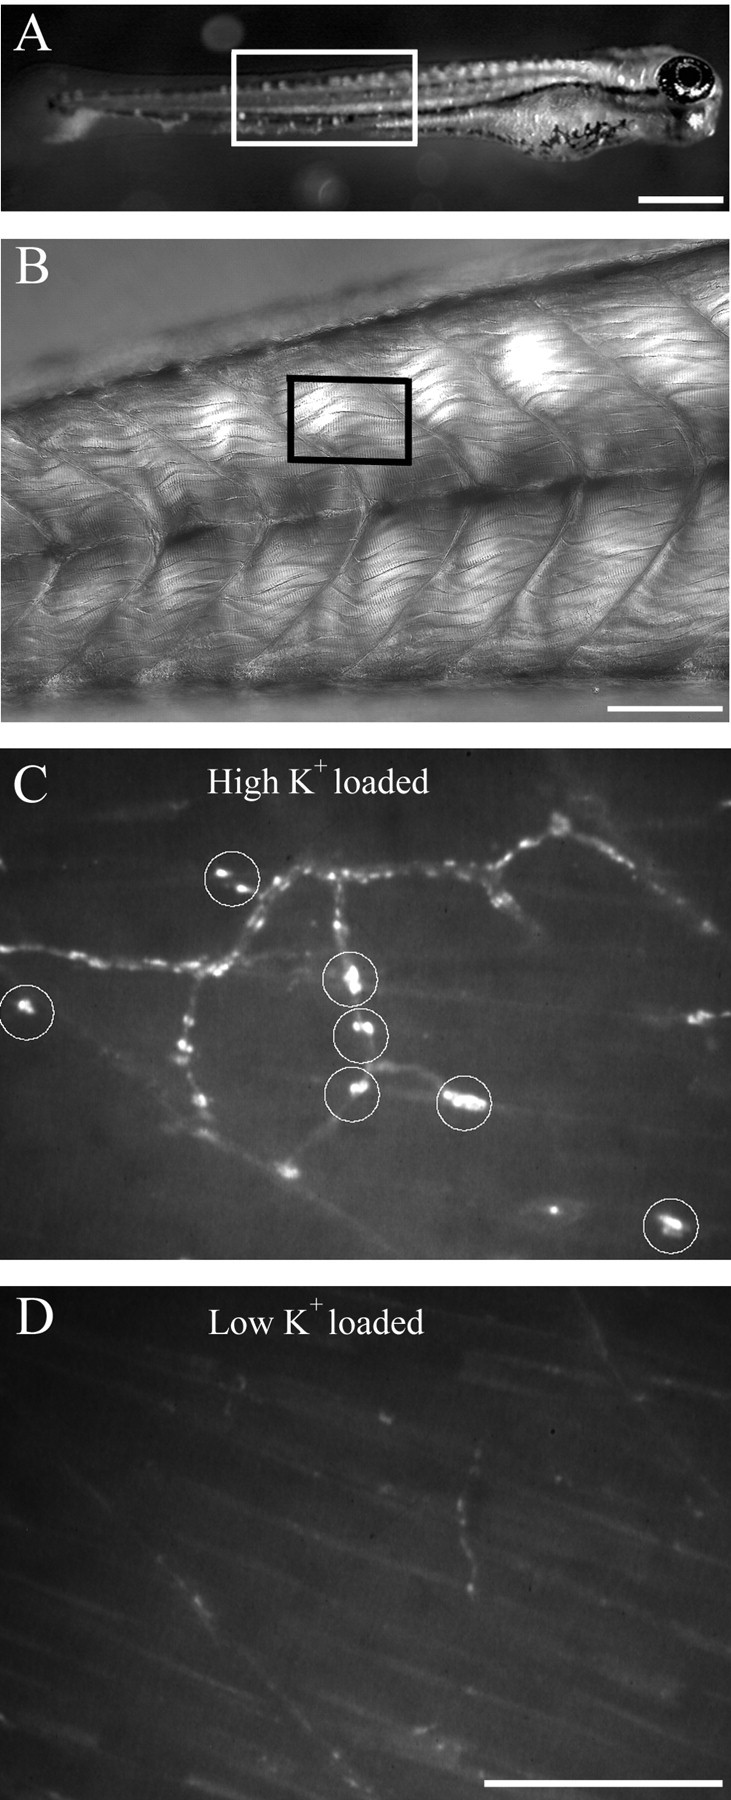
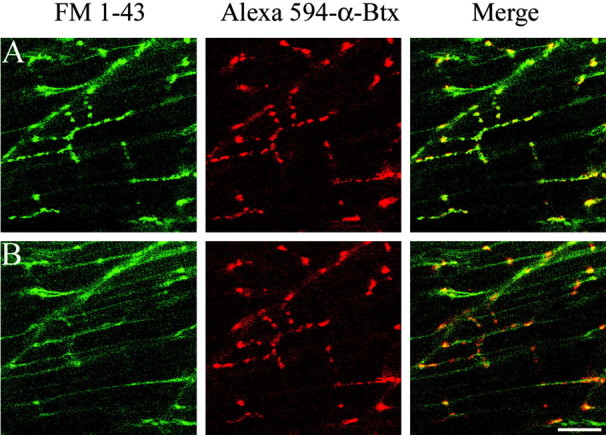
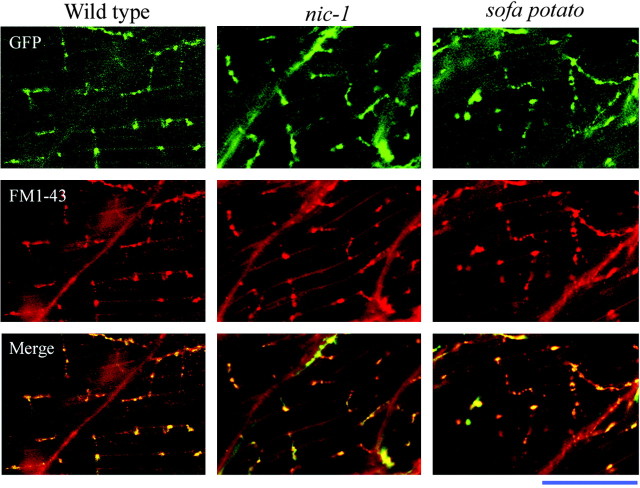
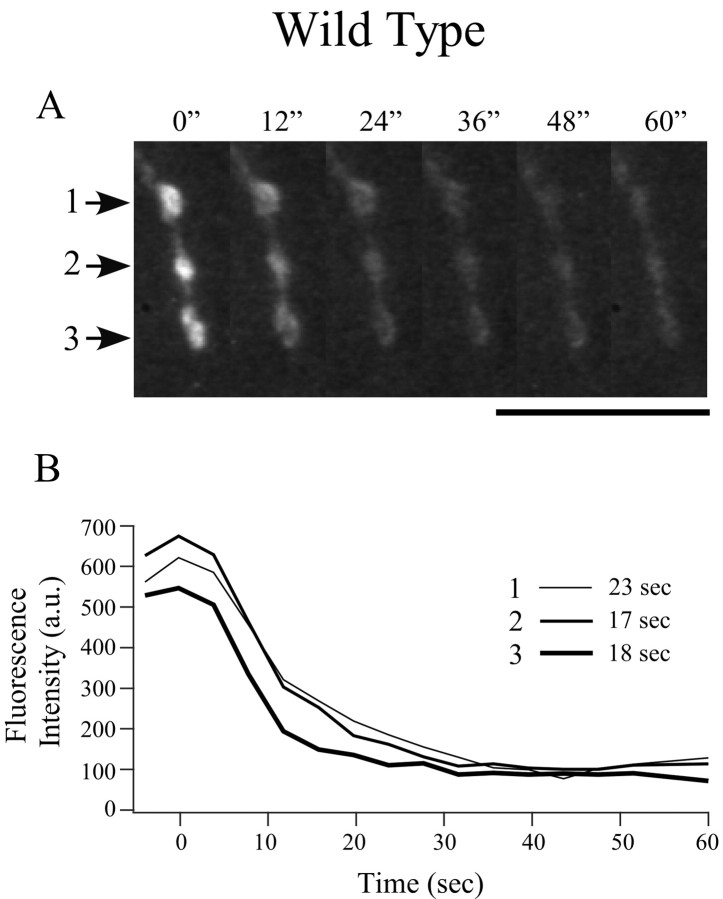
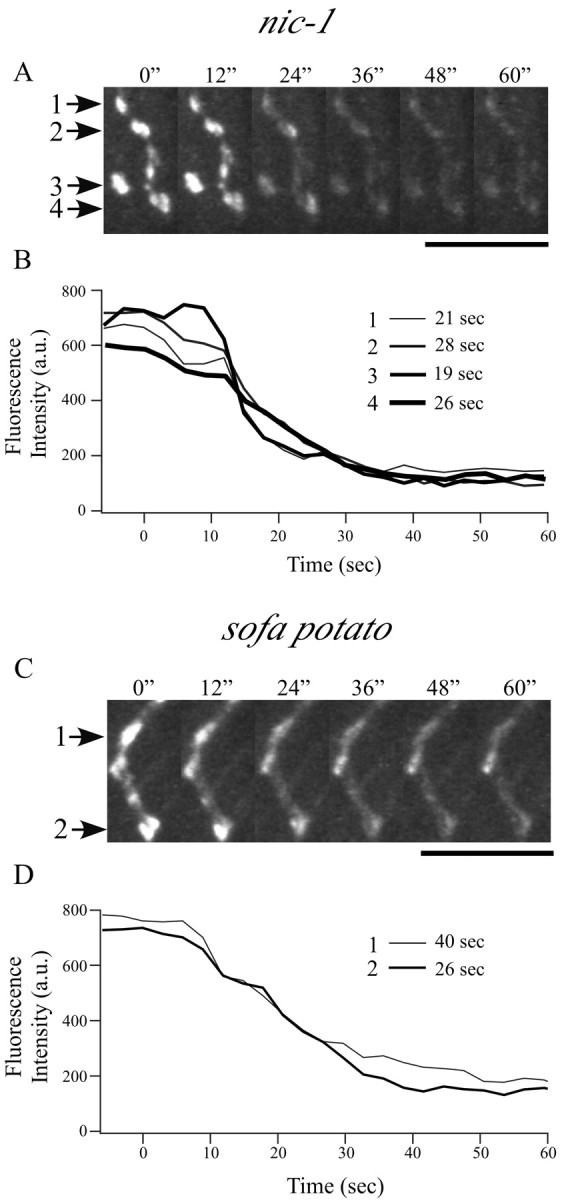
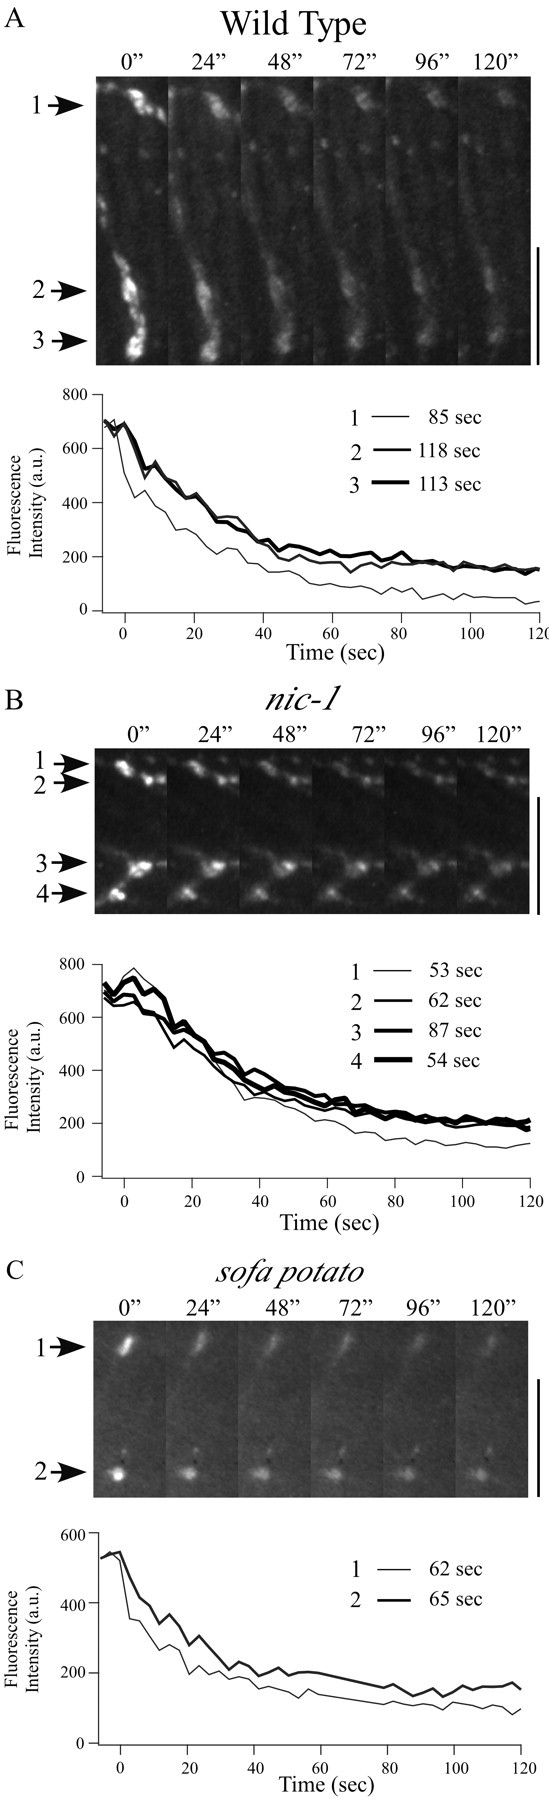
Differentiation of presynaptic nerve terminals is mediated, in part, through contact with the appropriate postsynaptic target cell. In particular, studies using dissociated nerve and muscle derived from Xenopus embryos have indicated that the properties of transmitter release from motor neurons are altered after contact with skeletal muscle. This maturation of presynaptic function has further been linked to retrograde signaling from muscle that involves activation of postsynaptic ACh receptors. Using FM1-43 optical determinants of exocytosis, we now compare calcium-mediated exocytosis at neuromuscular junctions of wild-type zebrafish to mutant fish lacking postsynaptic ACh receptors. In response to either high-potassium depolarization or direct electrical stimulation, we observed no differences in the rate or extent of FM1-43 destaining. These data indicate that the acquisition of stimulus-evoked exocytosis at early developmental stages occurs independent of both postsynaptic receptor and synaptic responses in zebrafish.
Figures
Similar articles
-
Ouabain evokes exocytosis dependent on ryanodine and mitochondrial calcium stores that is not followed by compensatory endocytosis at the neuromuscular junction.Neurochem Int. 2009 Nov;55(6):406-13. doi: 10.1016/j.neuint.2009.04.009. Epub 2009 May 4. Neurochem Int. 2009. PMID: 19406178
-
The role of extracellular calcium in exo- and endocytosis of synaptic vesicles at the frog motor nerve terminals.Neuroscience. 2006 Dec 28;143(4):905-10. doi: 10.1016/j.neuroscience.2006.08.025. Epub 2006 Sep 26. Neuroscience. 2006. PMID: 17000054
-
Impairment of synaptic vesicle exocytosis and recycling during neuromuscular weakness produced in mice by 2,4-dithiobiuret.J Neurophysiol. 2002 Dec;88(6):3243-58. doi: 10.1152/jn.00934.2001. J Neurophysiol. 2002. PMID: 12466444
-
Exocytosis and endocytosis of synaptic vesicles and functional roles of vesicle pools: lessons from the Drosophila neuromuscular junction.Neuroscientist. 2005 Apr;11(2):138-47. doi: 10.1177/1073858404271679. Neuroscientist. 2005. PMID: 15746382 Review.
-
The synaptic bouton acts like a salt shaker.Cell Biochem Biophys. 2004;41(2):259-64. doi: 10.1385/cbb:41:2:259. Cell Biochem Biophys. 2004. PMID: 15475612 Review.
Cited by
-
Nonequivalent release sites govern synaptic depression.Proc Natl Acad Sci U S A. 2016 Jan 19;113(3):E378-86. doi: 10.1073/pnas.1523671113. Epub 2015 Dec 29. Proc Natl Acad Sci U S A. 2016. PMID: 26715759 Free PMC article.
-
Acetylcholine receptors direct rapsyn clusters to the neuromuscular synapse in zebrafish.J Neurosci. 2004 Jun 16;24(24):5475-81. doi: 10.1523/JNEUROSCI.0851-04.2004. J Neurosci. 2004. PMID: 15201319 Free PMC article.
-
Paired patch clamp recordings from motor-neuron and target skeletal muscle in zebrafish.J Vis Exp. 2010 Nov 20;(45):2351. doi: 10.3791/2351. J Vis Exp. 2010. PMID: 21113124 Free PMC article.
-
A modified acetylcholine receptor delta-subunit enables a null mutant to survive beyond sexual maturation.J Neurosci. 2008 Dec 3;28(49):13223-31. doi: 10.1523/JNEUROSCI.2814-08.2008. J Neurosci. 2008. PMID: 19052214 Free PMC article.
-
Essential roles of the acetylcholine receptor gamma-subunit in neuromuscular synaptic patterning.Development. 2008 Jun;135(11):1957-67. doi: 10.1242/dev.018119. Epub 2008 Apr 23. Development. 2008. PMID: 18434415 Free PMC article.
References
Publication types
MeSH terms
Substances
Grants and funding
LinkOut - more resources
Full Text Sources