

Independent component analysis of functional MRI: what is signal and what is noise?
- PMID: 14630228
- PMCID: PMC2925426
- DOI: 10.1016/j.conb.2003.09.012
Independent component analysis of functional MRI: what is signal and what is noise?
Abstract
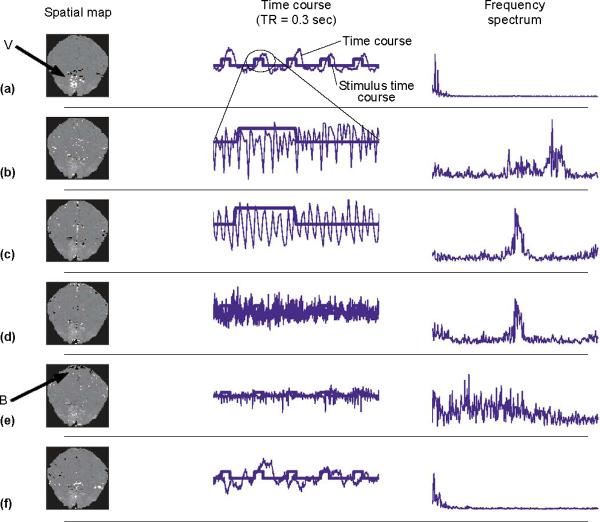
Many sources of fluctuation contribute to the functional magnetic resonance imaging (fMRI) signal, complicating attempts to infer those changes that are truly related to brain activation. Unlike methods of analysis of fMRI data that test the time course of each voxel against a hypothesized waveform, data-driven methods, such as independent component analysis and clustering, attempt to find common features within the data. This exploratory approach can be revealing when the brain activation is difficult to predict beforehand, such as with complex stimuli and internal shifts of activation that are not time-locked to an easily specified sensory or motor event. These methods can be further improved by incorporating prior knowledge regarding the temporal and spatial extent of brain activation.
Figures
Similar articles
-
Automatic denoising of functional MRI data: combining independent component analysis and hierarchical fusion of classifiers.Neuroimage. 2014 Apr 15;90:449-68. doi: 10.1016/j.neuroimage.2013.11.046. Epub 2014 Jan 2. Neuroimage. 2014. PMID: 24389422 Free PMC article.
-
Analysis of FMRI data using an integrated principal component analysis and supervised affinity propagation clustering approach.IEEE Trans Biomed Eng. 2011 Nov;58(11):3184-96. doi: 10.1109/TBME.2011.2165542. Epub 2011 Aug 22. IEEE Trans Biomed Eng. 2011. PMID: 21859596
-
Functional principal component analysis of fMRI data.Hum Brain Mapp. 2005 Feb;24(2):109-29. doi: 10.1002/hbm.20074. Hum Brain Mapp. 2005. PMID: 15468155 Free PMC article.
-
Mining EEG-fMRI using independent component analysis.Int J Psychophysiol. 2009 Jul;73(1):53-61. doi: 10.1016/j.ijpsycho.2008.12.018. Epub 2009 Feb 15. Int J Psychophysiol. 2009. PMID: 19223007 Free PMC article. Review.
-
Modelling with independent components.Neuroimage. 2012 Aug 15;62(2):891-901. doi: 10.1016/j.neuroimage.2012.02.020. Epub 2012 Feb 18. Neuroimage. 2012. PMID: 22369997 Review.
Cited by
-
Unraveling the spatiotemporal brain dynamics during a simulated reach-to-eat task.Neuroimage. 2019 Jan 15;185:58-71. doi: 10.1016/j.neuroimage.2018.10.028. Epub 2018 Oct 10. Neuroimage. 2019. PMID: 30315910 Free PMC article.
-
Decreased small-world functional network connectivity and clustering across resting state networks in schizophrenia: an fMRI classification tutorial.Front Hum Neurosci. 2013 Sep 2;7:520. doi: 10.3389/fnhum.2013.00520. eCollection 2013. Front Hum Neurosci. 2013. PMID: 24032010 Free PMC article.
-
Omission of temporal nuisance regressors from dual regression can improve accuracy of fMRI functional connectivity maps.Hum Brain Mapp. 2019 Oct 1;40(14):4005-4025. doi: 10.1002/hbm.24692. Epub 2019 Jun 12. Hum Brain Mapp. 2019. PMID: 31187917 Free PMC article.
-
Independent component analysis for brain FMRI does indeed select for maximal independence.PLoS One. 2013 Aug 29;8(8):e73309. doi: 10.1371/journal.pone.0073309. eCollection 2013. PLoS One. 2013. PMID: 24009746 Free PMC article.
-
Design of Deep Learning Model for Task-Evoked fMRI Data Classification.Comput Intell Neurosci. 2021 Aug 12;2021:6660866. doi: 10.1155/2021/6660866. eCollection 2021. Comput Intell Neurosci. 2021. PMID: 34422034 Free PMC article.
References
-
- Smith AM, Lewis BK, Ruttimann UE, Ye FQ, Sinnwell TM, Yang Y, Duyn JH, Frank JA. Investigation of low frequency drift in fMRI signal. Neuroimage. 1999;9:526–533. - PubMed
-
- Jiang H, Golay X, van Zijl PC, Mori S. Origin and minimization of residual motion-related artifacts in navigator-corrected segmented diffusion-weighted EPI of the human brain. Magn Reson Med. 2002;47:818–822. - PubMed
-
- Buchanan J. In: Principles and Practice of Positron Emission Tomography. Wahl R, editor. Williams & Wilkins Publishers; Lippincott: 2002.
-
- Gusnard DA, Raichle ME. Searching for a baseline: functional imaging and the resting human brain. Nat Rev Neurosci. 2001;2:685–694. - PubMed
-
- Lange N, Strother SC, Anderson JR, Nielsen FA, Holmes AP, Kolenda T, Savoy R, Hansen LK. Plurality and resemblance in fMRI data analysis. Neuroimage. 1999;10:282–303. - PubMed
Publication types
MeSH terms
Grants and funding
LinkOut - more resources
Full Text Sources
Other Literature Sources
Medical
