. 2003 Dec;15(12):2992-3006.
doi: 10.1105/tpc.016766. Epub 2003 Nov 20.

Regulation of methylbenzoate emission after pollination in snapdragon and petunia flowers

Affiliations

Regulation of methylbenzoate emission after pollination in snapdragon and petunia flowers

Florence Negre et al. Plant Cell. 2003 Dec.

Abstract

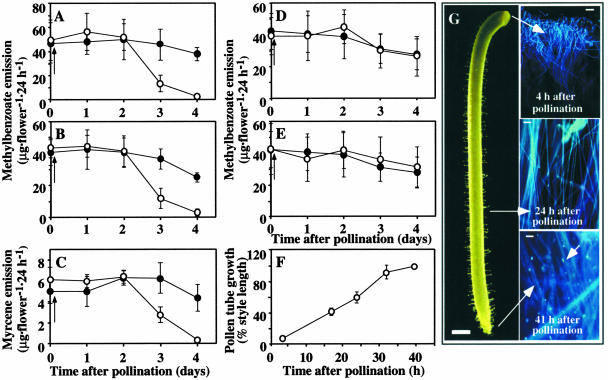
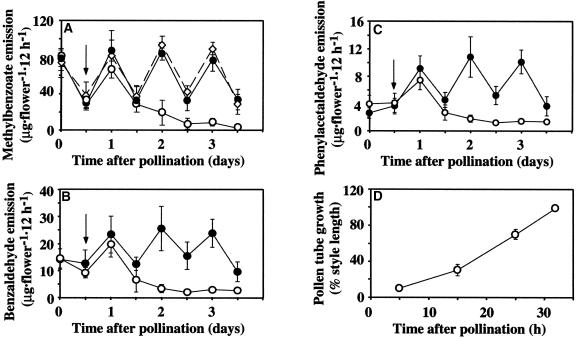
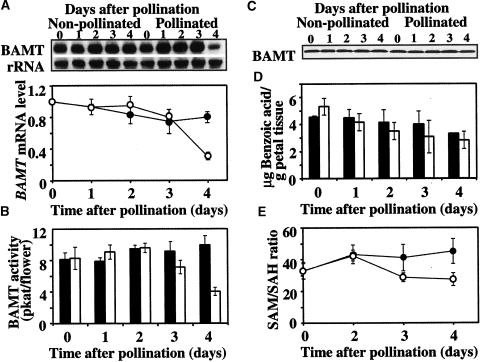
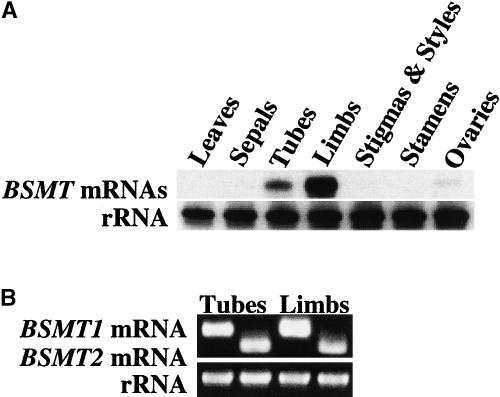
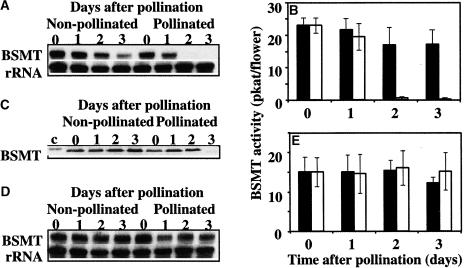
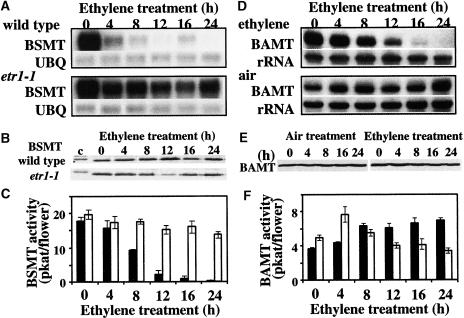
The molecular mechanisms responsible for postpollination changes in floral scent emission were investigated in snapdragon cv Maryland True Pink and petunia cv Mitchell flowers using a volatile ester, methylbenzoate, one of the major scent compounds emitted by these flowers, as an example. In both species, a 70 to 75% pollination-induced decrease in methylbenzoate emission begins only after pollen tubes reach the ovary, a process that takes between 35 and 40 h in snapdragon and approximately 32 h in petunia. This postpollination decrease in emission is not triggered by pollen deposition on the stigma. Petunia and snapdragon both synthesize methylbenzoate from benzoic acid and S-adenosyl-l-methionine (SAM); however, they use different mechanisms to downregulate its production after pollination. In petunia, expression of the gene responsible for methylbenzoate synthesis is suppressed by ethylene. In snapdragon, the decrease in methylbenzoate emission is the result of a decrease in both S-adenosyl-l-methionine:benzoic acid carboxyl methyltransferase (BAMT) activity and the ratio of SAM to S-adenosyl-l-homocysteine ("methylation index") after pollination, although the BAMT gene also is sensitive to ethylene.


Figures

Figure 1.
Figure 1.
Effect of Pollination on Floral Scent Emission and Pollen Tube Movement in Snapdragon Flowers. (A) and (B) Emission of methylbenzoate in snapdragon flowers pollinated with self pollen on day 4 (A) and day 5 (B) after anthesis. (C) Emission of myrcene in snapdragon flowers pollinated with self pollen on day 5 after anthesis. (D) and (E) Emission of methylbenzoate in snapdragon flowers pollinated on day 5 after anthesis with foreign pollen (D) and heat-inactivated self-pollen (E). Closed circles represent emission in unpollinated flowers, and open circles represent emission in pollinated flowers. Arrows indicate the time of pollination. Standard deviations are indicated by vertical bars. Each point is the average of 7 and 10 independent scent collections for unpollinated and pollinated flowers, respectively, in (A), 8 independent scent collections for unpollinated and pollinated flowers in (B), 4 and 7 independent scent collections for unpollinated and pollinated flowers, respectively, in (C), and 10 and 6 independent scent collections for unpollinated and pollinated flowers, respectively, in (D) and (E). (F) and (G) Pollen tube growth in snapdragon styles pollinated on day 5 after anthesis. (F) Average style length is 2.02 ± 0.02 cm (n = 30). Five styles were used at each time point. (G) Styles were fixed and stained with aniline blue at different times after pollination. Stained pollen tubes were visualized by fluorescence microscopy (at right). Bars = 1 mm (pistil), 50 μm (4 h after pollination), and 25 μm (24 and 41 h after pollination).
Figure 2.
Figure 2.
Effect of Pollination on Floral Scent Emission and Pollen Tube Movement in Petunia Flowers. (A) Emission of methylbenzoate in wild-type and etr1-1 petunia flowers pollinated with self pollen on the night of day 2 after anthesis. (B) and (C) Emission of benzaldehyde (B) and phenylacetaldehyde (C) in wild-type petunia flowers pollinated with self pollen on the night of day 2 after anthesis. Increases in the amount of benzaldehyde and phenylacetaldehyde at 1 day after pollination relative to the emission on the day of pollination reflect developmental changes. Closed circles represent emission in unpollinated wild-type flowers, and open circles and open diamonds represent emission in pollinated wild-type and etr1-1 flowers, respectively. Arrows indicate the time of pollination. Standard deviations are indicated by vertical bars. Each point is the average of five and six independent scent collections for unpollinated and pollinated wild-type flowers, respectively, and four independent scent collections for etr1-1 flowers. (D) Pollen tube growth in petunia styles pollinated on the night of day 2 after anthesis. Average style length is 4.15 ± 0.03 cm (n = 30). Three styles were used at each time point. Standard deviations are indicated by vertical bars.
Figure 3.
Figure 3.
Effect of Pollination on BAMT Gene Expression, BAMT Activity, the Levels of BAMT Protein and Benzoic Acid, and SAM/SAH Ratio in Snapdragon Flowers Pollinated on Day 5 after Anthesis. (A) RNA gel blot analysis of steady state BAMT mRNA levels in unpollinated and pollinated snapdragon flowers at different times after pollination. Total RNA was isolated from upper and lower petal lobes of snapdragon flowers pollinated on day 5 after anthesis at the times indicated at top, and 5 μg of total RNA was loaded in each lane. The top gel represents the results of hybridization with a BAMT probe. Autoradiography was performed overnight. The blot was rehybridized with an 18S rDNA probe (bottom gel) to standardize samples. RNA gel blots were scanned with a PhosphorImager, and values were used to generate a graph of fluctuation in relative BAMT mRNA levels after pollination. Each point on the graph is the average of eight independent experiments The transcript level on the day before pollination was taken as 1. Closed and open circles represent transcript levels in unpollinated and pollinated flowers, respectively. Standard error values are indicated by vertical bars. (B) BAMT activity in unpollinated and pollinated snapdragon flowers at different times after pollination. For each time point, enzyme assays were run in duplicate on at least three independent crude extract preparations for unpollinated and pollinated flowers, and the standard deviations (indicated by vertical bars) were obtained. Closed bars represent BAMT activity in unpollinated flowers, and open bars represent BAMT activity in pollinated flowers. (C) BAMT protein levels in unpollinated and pollinated snapdragon flowers at different times after pollination. The representative protein gel blot shows the 49-kD protein recognized by anti-BAMT antibodies. Proteins were extracted from upper and lower petal lobes at the times after pollination indicated at top, and 11 μg of protein was loaded in each lane. (D) Amount of benzoic acid in unpollinated and pollinated snapdragon flowers at different times after pollination. Benzoic acid was extracted from upper and lower petal lobes by supercritical carbon dioxide extraction and analyzed by HPLC. Closed bars represent benzoic acid levels in unpollinated flowers, and open bars represent benzoic acid levels in pollinated flowers. Standard error values are indicated by vertical bars. Each point is the average of three independent experiments. (E) Levels of the SAM/SAH ratio in unpollinated and pollinated snapdragon flowers at different times after pollination. Closed and open circles represent the SAM/SAH ratio in unpollinated flowers and pollinated flowers, respectively. Standard error values are indicated by vertical bars. Each point is the average of three independent experiments. SAM and SAH levels on the day before pollination were 38.99 ± 4.01 and 1.21 ± 0.14 nmol/g fresh weight, respectively, where ± corresponds to a 95% confidence interval of the mean.
Figure 4.
Figure 4.
Tissue Specificity of Petunia BSMT Gene Expression. (A) RNA gel blot of total RNA (5 μg per lane) isolated from young leaves, sepals, tubes and limbs of corollas, pistils, stamens, and ovaries of 2-day-old petunia flowers. The top gel represents the results of hybridization with a coding region of the BSMT genes as a probe. The length of the BSMT mRNA was estimated as 1.5 kb using RNA molecular markers in an adjacent lane. Autoradiography was performed overnight. The blot was rehybridized with an 18S rDNA probe (bottom) to standardize samples. (B) Contribution of each BSMT gene to total BSMT expression. RT-PCR with gene-specific primers was performed on RNA isolated from the limbs and tubes of 2-day-old petunia corollas. The amplified products were run on a 1.2% agarose gel and stained with ethidium bromide. The RT-PCR products for rRNA are shown at bottom.
Figure 5.
Figure 5.
Effect of Pollination on BSMT Gene Expression, BSMT Activity toward Benzoic Acid, and Protein Level in Wild-Type and etr1-1 Petunia Flowers. (A) and (D) BSMT gene expression in unpollinated and pollinated wild-type (A) and etr1-1 (D) petunia flowers at different times after pollination. Total RNA was isolated from the limbs and tubes of corollas of petunia flowers pollinated on day 2 after anthesis at the times indicated at top, and 5 μg of total RNA was loaded in each lane. The top gels represent the results of hybridization with a BSMT probe. Autoradiography was performed overnight. The blots were rehybridized with an 18S rDNA probe (bottom) to standardize samples. Each blot represents a typical result of three independent experiments. (B) and (E) BSMT activity toward benzoic acid in unpollinated and pollinated wild-type (B) and etr1-1 (E) petunia flowers at different times after pollination. For each time point, enzyme assays were run in duplicate on at least four (B) and three (E) independent crude extract preparations for unpollinated and pollinated flowers. Closed and open bars represent BSMT activity toward benzoic acid in unpollinated and pollinated flowers, respectively. Standard error values are indicated by vertical bars. (C) BSMT protein levels in unpollinated and pollinated petunia flowers at different times after pollination. The representative protein gel blot shows the 45-kD protein recognized by anti-SAMT antibodies. Proteins were extracted from petunia petals at the times after pollination indicated at top, and 12 μg of protein was loaded in each lane. A total of 0.76 μg of pure BSMT2 protein was loaded in the first (left) lane and used as a control. The blot shown here represents a typical result of three independent experiments.
Figure 6.
Figure 6.
Effect of Ethylene Treatment on BSMT and BAMT Gene Expression, Protein Levels, and Corresponding Enzyme Activities in Petunia and Snapdragon Flowers. (A) BSMT gene expression in wild-type and etr1-1 petunia petals after different periods of ethylene treatment. Poly(A) mRNA was isolated from whole flowers at anthesis after the periods of ethylene treatment indicated at top, and 2 μg of mRNA was loaded in each lane. The top gels for the wild type and etr1-1 represent the results of hybridization with a BSMT probe. Autoradiography was performed overnight. The blots were rehybridized with a ubiquitin probe (UBQ) to standardize samples. Each blot represents a typical result of three independent experiments. (B) BSMT protein levels in wild-type and etr1-1 petunia flowers after different periods of ethylene treatment. Representative protein gel blots show the 45-kD protein recognized by anti-SAMT antibodies. Proteins were extracted from petunia petals after the periods of ethylene treatment indicated at top, and 12 μg of protein was loaded in each lane. A total of 0.76 μg of pure BSMT2 protein was loaded in the first (left) lane and used as a control (c). Each blot represents a typical result of three independent experiments. (C) BSMT activity toward benzoic acid in wild-type and etr1-1 petunia flowers after different periods of ethylene treatment. Closed and open bars represent BSMT activity toward benzoic acid in wild-type and etr1-1 flowers, respectively. For each time point, enzyme assays were run in duplicate on at least four independent crude extract preparations for both wild-type and etr1-1 flowers, and the standard deviations indicated by vertical bars were obtained. (D) BAMT gene expression in upper and lower petal lobes of snapdragon flowers after different periods of ethylene treatment. Flowers treated with air were used as a control. Total RNA was isolated from upper and lower petal lobes of 5-day-old snapdragon flowers after the periods of ethylene or air treatment indicated at top, and 5 μg of total RNA was loaded in each lane. The top gel for each experiment represents the results of hybridization with a BAMT probe. Autoradiography was performed overnight. The blots were rehybridized with an 18S rDNA probe (bottom gels) to standardize samples. Each blot represents a typical result of three independent experiments. (E) BAMT protein levels in snapdragon flowers treated with ethylene and air (control) after different periods of treatment. The representative protein gel blot shows the 49-kD protein recognized by anti-BAMT antibodies. Proteins were extracted from upper and lower petal lobes, and 11 μg of protein was loaded in each lane. The blot shown represents a typical result of three independent experiments. (F) BAMT activity in snapdragon flowers treated with ethylene and air (control) after different periods of treatment. Enzyme assays were run in duplicate for each time point on at least five independent crude extract preparations for both ethylene- and air-treated flowers, and the standard deviations indicated by vertical bars were obtained. Closed and open bars represent BAMT activity in air- and ethylene-treated snapdragon flowers.

References

    1. Arditti, J. (1979). Aspects of the physiology of orchids. In Advances in Botanical Research, Vol. 7, H.W. Woolhouse, ed (London: Academic Press), pp. 421–655.
    1. Cantoni, G.L., Richards, H.H., and Chiang, P.K. (1979). Inhibitors of S-adenosylhomocysteine hydrolase and their role in the regulation of biological methylation. In Transmethylation, E. Usdin, R.T. Borchardt, and C.R. Creveling, eds (Amsterdam: Elsevier-North Holland), pp. 155–164.
    1. Capdevila, A., and Wagner, C. (1998). Measurement of plasma S-adenosylmethionine and S-adenosylhomocysteine as their fluorescent isoindoles. Anal. Biochem. 264, 180–184. - PubMed
    1. Chang, S.C., and Gallie, D.R. (1997). RNase activity decreases following a heat shock in wheat leaves and correlates with its posttranslational modification. Plant Physiol. 113, 1253–1263. - PMC - PubMed
    1. Ciardi, J.A., Tieman, D.M., Lund, S.T., Jones, J.B., Stall, R.E., and Klee, H.J. (2000). Response to Xanthomonas campestris pv. vesicatoria in tomato involves regulation of ethylene receptor gene expression. Plant Physiol. 123, 81–92. - PMC - PubMed

Publication types

MeSH terms

Associated data

LinkOut - more resources