

Gene expression patterns and gene copy number changes in dermatofibrosarcoma protuberans
- PMID: 14633610
- PMCID: PMC1892373
- DOI: 10.1016/S0002-9440(10)63593-6
Gene expression patterns and gene copy number changes in dermatofibrosarcoma protuberans
Abstract
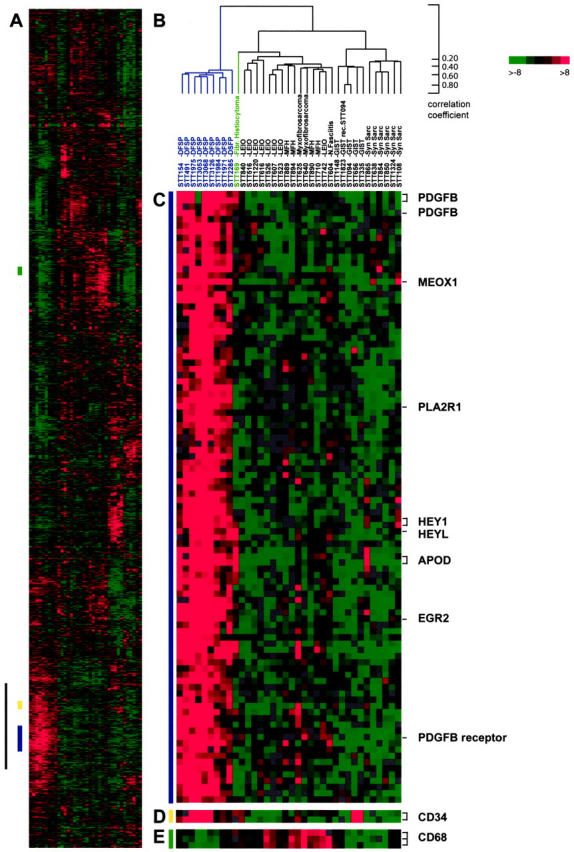
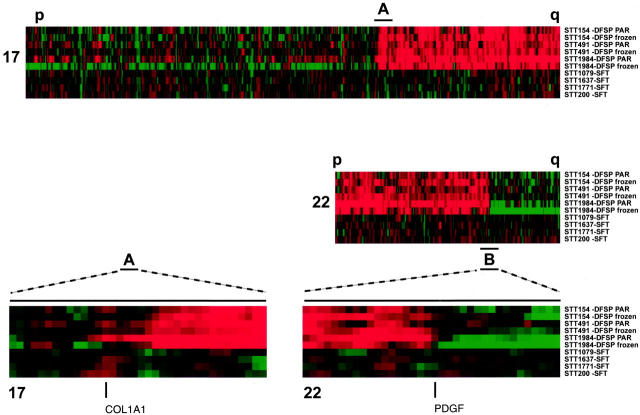
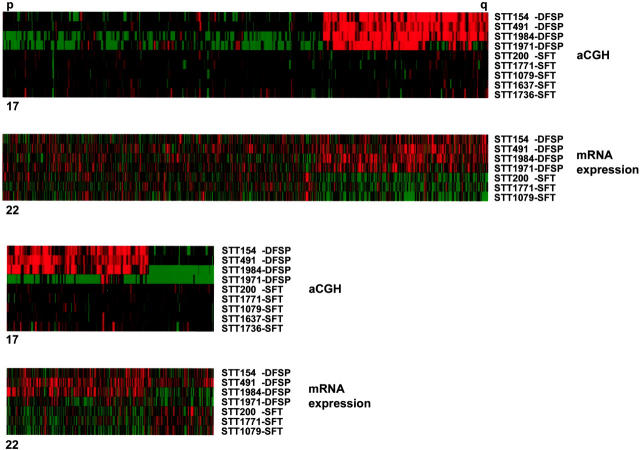
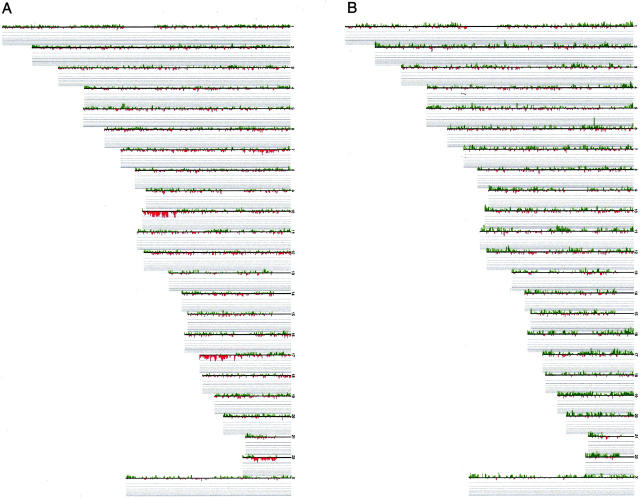
Dermatofibrosarcoma protuberans (DFSP) is an aggressive spindle cell neoplasm. It is associated with the chromosomal translocation, t(17:22), which fuses the COL1A1 and PDGFbeta genes. We determined the characteristic gene expression profile of DFSP and characterized DNA copy number changes in DFSP by array-based comparative genomic hybridization (array CGH). Fresh frozen and formalin-fixed, paraffin-embedded samples of DFSP were analyzed by array CGH (four cases) and DNA microarray analysis of global gene expression (nine cases). The nine DFSPs were readily distinguished from 27 other diverse soft tissue tumors based on their gene expression patterns. Genes characteristically expressed in the DFSPs included PDGF beta and its receptor, PDGFRB, APOD, MEOX1, PLA2R, and PRKCA. Array CGH of DNA extracted either from frozen tumor samples or from paraffin blocks yielded equivalent results. Large areas of chromosomes 17q and 22q, bounded by COL1A1 and PDGF beta, respectively, were amplified in DFSP. Expression of genes in the amplified regions was significantly elevated. Our data shows that: 1) DFSP has a distinctive gene expression profile; 2) array CGH can be applied successfully to frozen or formalin-fixed, paraffin-embedded tumor samples; 3) a characteristic amplification of sequences from chromosomes 17q and 22q, demarcated by the COL1A1 and PDGF beta genes, respectively, was associated with elevated expression of the amplified genes.
Figures
Similar articles
-
Gene copy number changes in dermatofibrosarcoma protuberans - a fine-resolution study using array comparative genomic hybridization.Cytogenet Genome Res. 2006;115(3-4):283-8. doi: 10.1159/000095925. Cytogenet Genome Res. 2006. PMID: 17124411
-
Concomitant DNA copy number amplification at 17q and 22q in dermatofibrosarcoma protuberans.Cytogenet Cell Genet. 2001;92(3-4):192-5. doi: 10.1159/000056901. Cytogenet Cell Genet. 2001. PMID: 11435686
-
Dermatofibrosarcoma protuberans COL1A1-PDGFB fusion is identified in virtually all dermatofibrosarcoma protuberans cases when investigated by newly developed multiplex reverse transcription polymerase chain reaction and fluorescence in situ hybridization assays.Hum Pathol. 2008 Feb;39(2):184-93. doi: 10.1016/j.humpath.2007.06.009. Epub 2007 Oct 24. Hum Pathol. 2008. PMID: 17950782
-
Multiple primary dermatofibrosarcoma protuberans tumors in a single patient with chromosomal microarray analysis: A case report and review.J Cutan Pathol. 2024 Jul;51(7):490-495. doi: 10.1111/cup.14612. Epub 2024 Mar 28. J Cutan Pathol. 2024. PMID: 38548658 Review.
-
Dermatofibrosarcoma protuberans: recent clinical progress.Ann Surg Oncol. 2007 Oct;14(10):2876-86. doi: 10.1245/s10434-007-9480-y. Epub 2007 Jul 24. Ann Surg Oncol. 2007. PMID: 17647063 Review.
Cited by
-
A rare case of dermatofibrosarcoma protuberans of the forefoot.Radiol Case Rep. 2016 Apr 4;11(2):102-5. doi: 10.1016/j.radcr.2016.02.013. eCollection 2016 Jun. Radiol Case Rep. 2016. PMID: 27257461 Free PMC article.
-
A statistical change point model approach for the detection of DNA copy number variations in array CGH data.IEEE/ACM Trans Comput Biol Bioinform. 2009 Oct-Dec;6(4):529-41. doi: 10.1109/TCBB.2008.129. IEEE/ACM Trans Comput Biol Bioinform. 2009. PMID: 19875853 Free PMC article.
-
Role of gene expression arrays in sarcomas.Curr Oncol Rep. 2004 Jul;6(4):309-14. doi: 10.1007/s11912-004-0041-2. Curr Oncol Rep. 2004. PMID: 15161587 Review.
-
A molecular map of mesenchymal tumors.Genome Biol. 2005;6(9):R76. doi: 10.1186/gb-2005-6-9-r76. Epub 2005 Aug 26. Genome Biol. 2005. PMID: 16168083 Free PMC article.
-
Fibrosarcomatous changes and expression of CD34+ and apolipoprotein-D in dermatofibrosarcoma protuberans.Clin Sarcoma Res. 2012 Jan 27;2(1):4. doi: 10.1186/2045-3329-2-4. Clin Sarcoma Res. 2012. PMID: 22587823 Free PMC article.
References
-
- Bowne WB, Antonescu CR, Leung DH, Katz SC, Hawkins WG, Woodruff JM, Brennan MF, Lewis JJ: Dermatofibrosarcoma protuberans: a clinicopathologic analysis of patients treated and followed at a single institution. Cancer 2000, 88:2711-2720 - PubMed
-
- Suit HD, Spiro IJ, Spear M: Benign and low-grade tumors of the soft tissues: role for radiation therapy. Cancer Treat Res 1997, 91:95-105 - PubMed
-
- Rubin BP, Schuetze SM, Eary JF, Norwood TH, Mirza S, Conrad EU, Bruckner JD: Molecular targeting of platelet-derived growth factor B by imatinib mesylate in a patient with metastatic dermatofibrosarcoma protuberans. J Clin Oncol 2002, 20:3586-3591 - PubMed
-
- Maki RG, Awan RA, Dixon RH, Jhanwar S, Antonescu CR: Differential sensitivity to imatinib of 2 patients with metastatic sarcoma arising from dermatofibrosarcoma protuberans. Int J Cancer 2002, 100:623-626 - PubMed
-
- Simon MP, Pedeutour F, Sirvent N, Grosgeorge J, Minoletti F, Coindre JM, Terrier-Lacombe MJ, Mandahl N, Craver RD, Blin N, Sozzi G, Turc-Carel C, O’Brien KP, Kedra D, Fransson I, Guilbaud C, Dumanski JP: Deregulation of the platelet-derived growth factor B-chain gene via fusion with collagen gene COL1A1 in dermatofibrosarcoma protuberans and giant-cell fibroblastoma. Nat Genet 1997, 15:95-98 - PubMed
Publication types
MeSH terms
Substances
Grants and funding
LinkOut - more resources
Full Text Sources
Other Literature Sources
Medical
Molecular Biology Databases
Miscellaneous
