. 2003 Dec;163(6):2433-40.
doi: 10.1016/S0002-9440(10)63598-5.

Myofibroblast and endothelial cell proliferation during murine myocardial infarct repair

Affiliations

Myofibroblast and endothelial cell proliferation during murine myocardial infarct repair

Jitka Ismail Virag et al. Am J Pathol. 2003 Dec.

Abstract

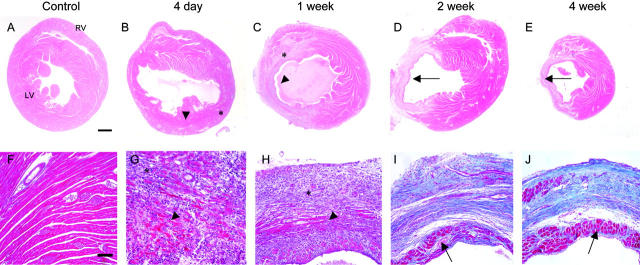
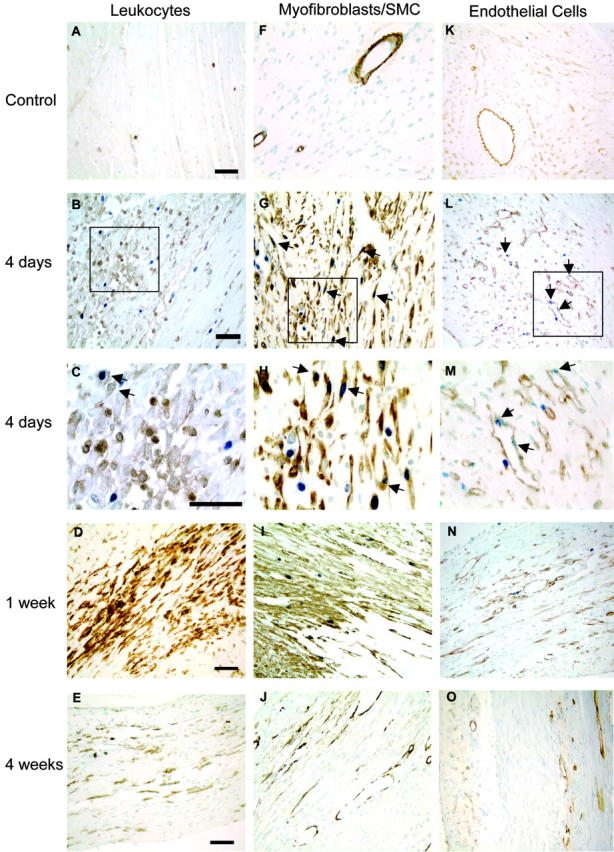
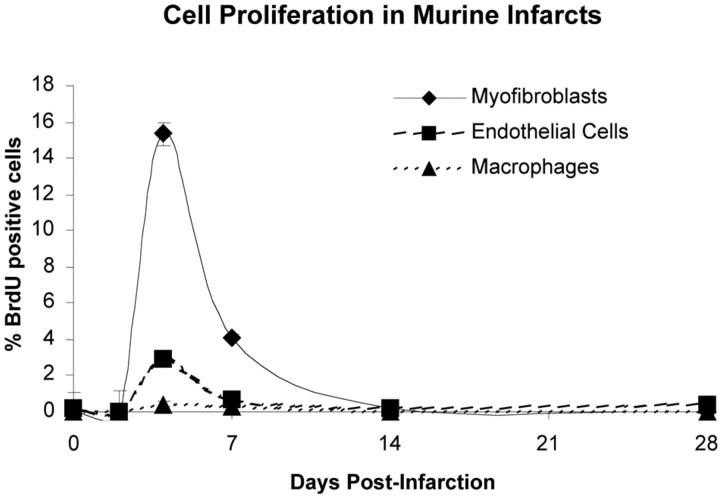
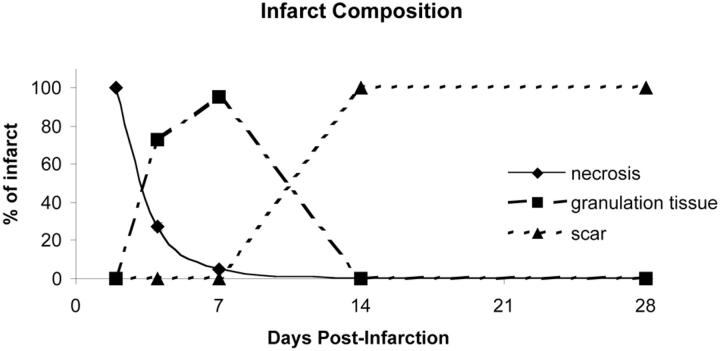
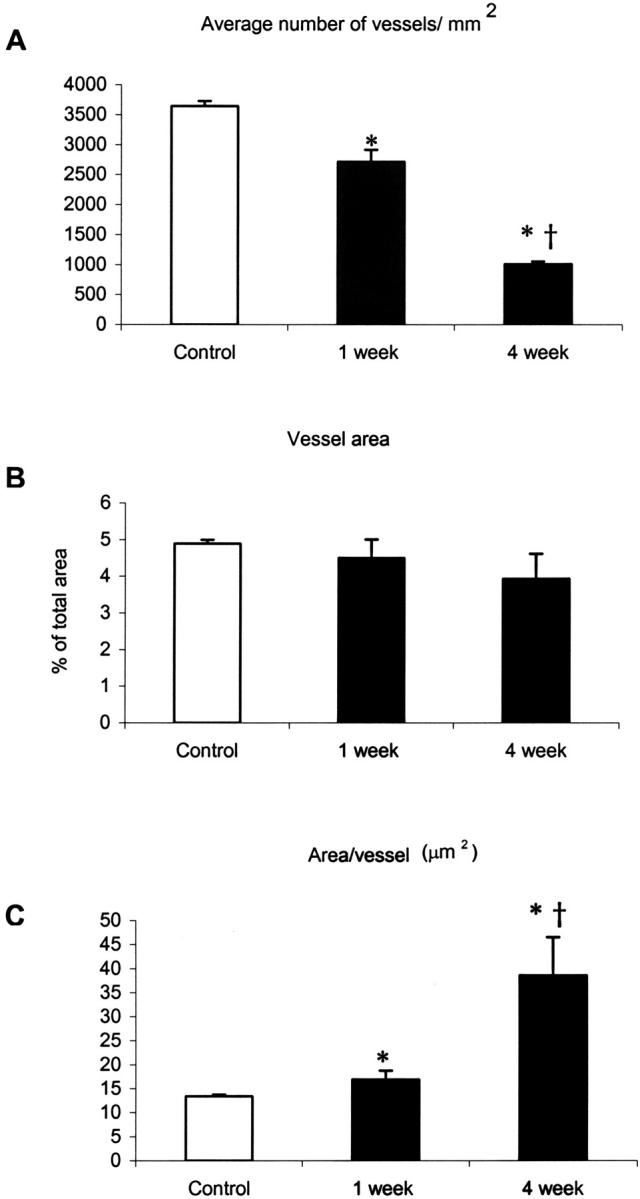
Granulation tissue formation is a critical step in infarct repair, however, the kinetics of cell replication and the molecules that regulate this process are poorly understood. In uninjured mouse hearts and at 2 days post-infarction, very little DNA synthesis (measured by incorporation of a BrdU pulse) was detected in any cell type. Four days after permanent coronary occlusion, the rates of myofibroblast (smooth muscle alpha-actin and BrdU double-positive) and endothelial cell (CD31 and BrdU double-positive) proliferation were 15.4 +/- 1.1% and 2.9 +/- 0.5%, respectively. Most proliferating cells were located at the interface of the infarct and viable tissue. By 1 week, fibroblast and endothelial cell proliferation declined to 4.1 +/- 0.6% and 0.7 +/- 0.1%, respectively. In the 2-week infarct, the remaining necrosis had been phagocytosed, and fibroblast and endothelial cell proliferation were <0.5%. Although leukocytes were abundant throughout infarct repair, no significant proliferation was detected at any time in cells expressing CD45 or mac-3. Infarct size at 4 days was 38 +/- 5% of the left ventricle and contracted to 20 +/- 4% by 4 weeks. After 4 days, the chamber dilated to four times that of the control hearts and remained so for the duration of the time course. The vascular density (per mm(2)) declined from 3643 +/- 82 in control hearts to 2716 +/- 197 at 1 week and 1010 +/- 47 at 4 weeks post-myocardial infarction (MI). The average percent area occupied by vessels did not change significantly between the groups but the area/vessel ( micro m(2)) increased from 14.1 +/- 0.3 in control hearts to 16.9 +/- 1.9 at 1 week and 38.7 +/- 7.9 at 4 weeks post-MI. These data indicate that mitogens for fibroblasts and endothelial cells peak within 4 days of infarction in the mouse heart. This provides the basis for identifying the responsible molecules and developing strategies to alter wound repair and improve cardiac function.


Figures

Figure 1.
Figure 1.
Histology of infarct repair. Hematoxylin and eosin stains (top row; ×20; bar, 0.5 mm) and Masson trichrome (bottom row; ×200; bar, 100 μm; pink, viable tissue; red, necrosis; blue, collagen) on tissues from control, 4-day, 1-week, 2-week, and 4-week murine infarcts. These photos demonstrate the intense inflammatory response that occurs at 4 days, the encapsulation of necrosis (arrowheads) by granulation tissue (*), the progressive thinning of the ventricular wall, ventricular chamber dilation, progressive collagen (blue) deposition, and subendocardial sparing (arrows).
Figure 2.
Figure 2.
Immunohistochemical analysis of proliferation in macrophages, myofibroblasts, and endothelial cells. In the left column, A–E are representative micrographs of CD45/BrdU staining, which highlight the extensive leukocyte infiltration throughout the repair process. The field in C shows two CD45-BrdU-positive cells highlighted in the upper left corner to illustrate the presence of these rare double-positive cells. In the middle column, F–J show the myofibroblast proliferation and migration pattern demonstrated by combined smooth muscle α-actin and BrdU staining. After 1 week, myofibroblast proliferation slows greatly, and the α-actin signal disappears from the interstitial cells, probably as a combined result of down-regulation of expression and apoptosis. In the right column, K–O, endothelial proliferation is illustrated by combined CD31 and BrdU staining. The peak of endothelial cell proliferation also occurs at 4 days. Vascularization of the wound occurs at 1 to 2 weeks, but vascular channel density appears to decline by 4 weeks. Examples of proliferating cells are marked by arrows. Original magnification, ×1000 for B, G, and L and ×400 for the other micrographs. Bars represent 50μm in each row.
Figure 3.
Figure 3.
Cell proliferation in murine infarcts. Infarcts show virtually no proliferation at 2 days. Proliferation shows an abrupt peak at 4 days post-MI, decreases at 1 week, and effectively ceases by 14 days. Mice received injection of BrdU 1 hour before sacrifice to mark proliferating cells. The percentage of proliferating cells was determined by counting the number of BrdU-positive cells out of 500 cells of each type per heart. At 4 days, 15.4 ± 0.9% of myofibroblasts were BrdU-positive, declining to 4.1 ± 1.1% at 1 week. Endothelial cells were 3 ± 0.1% BrdU-positive at 4 days and 0.7 ± 0.5% at 1 week. Macrophages did not proliferate significantly within the heart at any time.
Figure 4.
Figure 4.
Time course of changes in infarct composition during repair. This graph shows the duration and relative composition of the stages of wound repair. The majority of necrosis was phagocytosed 1 week post-MI. Granulation tissue formation began at 4 days, peaks at 1 week, and was resolved by 2 weeks post-MI. Scar tissue formation began 1 week post-MI and was complete by 2 weeks.
Figure 5.
Figure 5.
Vessel density and vessel area in control, and 1- and 4-week infarcts. Vessel density (per mm2) declined approximately 25% from control to 1 week and threefold from 1 week to 4 weeks in the infarct zone (A). The average area of all vessels combined per μm2 did not change (B). The average area of a vessel in the infarct at 4 weeks was more than twice that observed in 1-week and control hearts (C) (*, P < 0.01 versus control; , P < 0.05 versus 1-week).

References

    1. Fishbein MC, Maclean D, Maroko PR: Experimental myocardial infarction in the rat: qualitative and quantitative changes during pathologic evolution. Am J Pathol 1978, 90:57-70 - PMC - PubMed
    1. Frangogiannis NG, Smith CW, Entman ML: The inflammatory response in myocardial infarction. Cardiovasc Res 2002, 53:31-47 - PubMed
    1. Cleutjens JPM: The role of matrix metalloproteinases in heart disease. Cardiovasc Res 1996, 32:816-821 - PubMed
    1. Bing RJ: Myocardial ischemia and infarction: growth of ideas. Cardiovasc Res 2001, 51:13-20 - PubMed
    1. Murry CE, Giachelli CM, Schwartz SM, Vracko R: Macrophages express osteopontin during repair of myocardial necrosis. Am J Pathol 1994, 145:1450-1462 - PMC - PubMed

Publication types