. 2003 Dec;163(6):2459-76.
doi: 10.1016/s0002-9440(10)63601-2.

Ontogenetic transition in fetal wound transforming growth factor-beta regulation correlates with collagen organization

Affiliations

Ontogenetic transition in fetal wound transforming growth factor-beta regulation correlates with collagen organization

Chia Soo et al. Am J Pathol. 2003 Dec.

Abstract

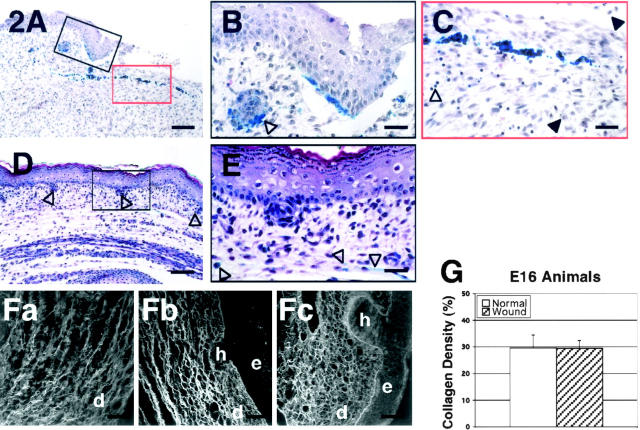
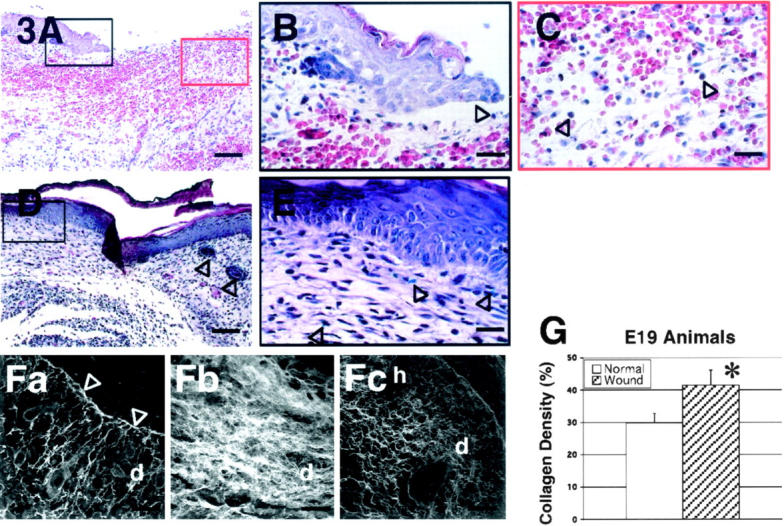
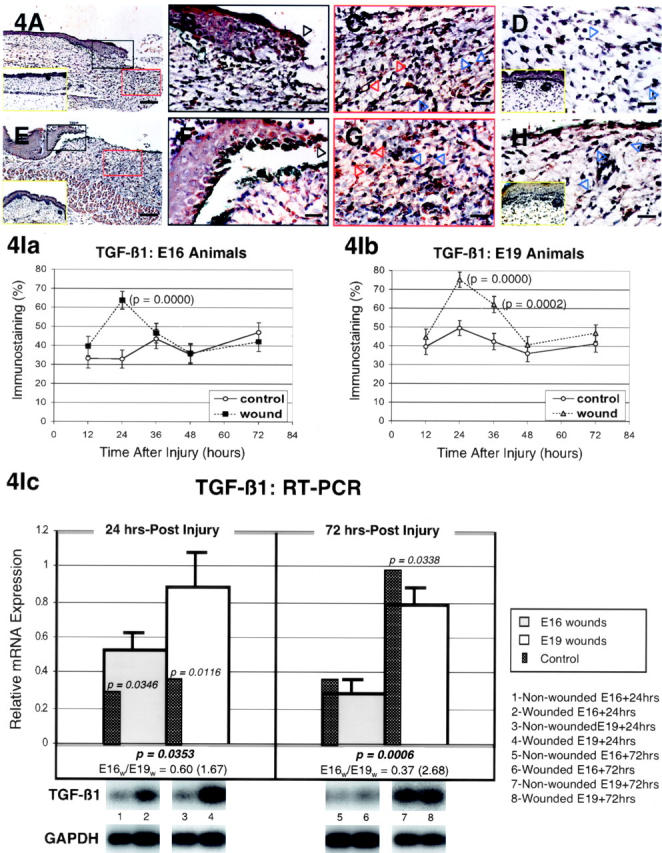
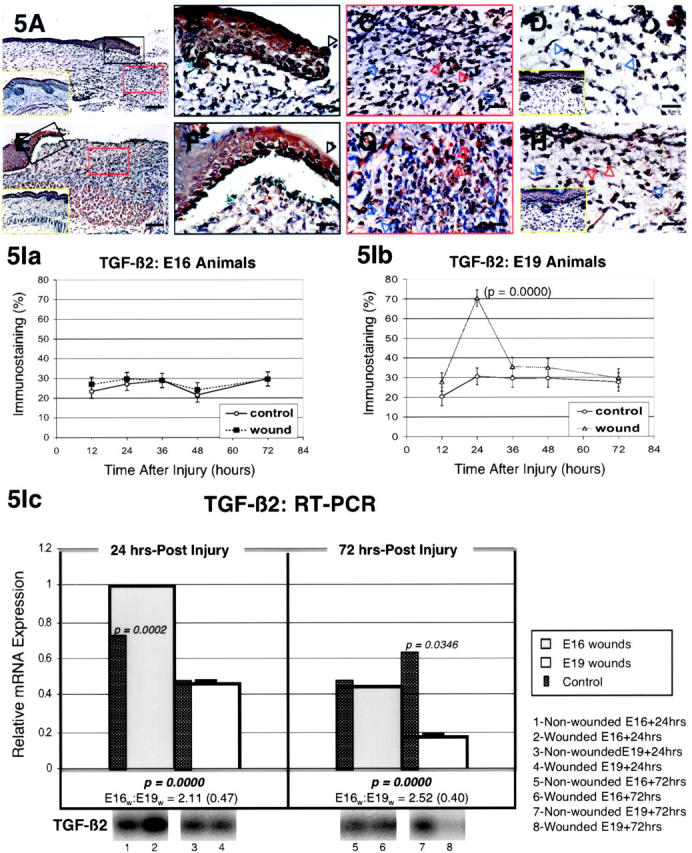
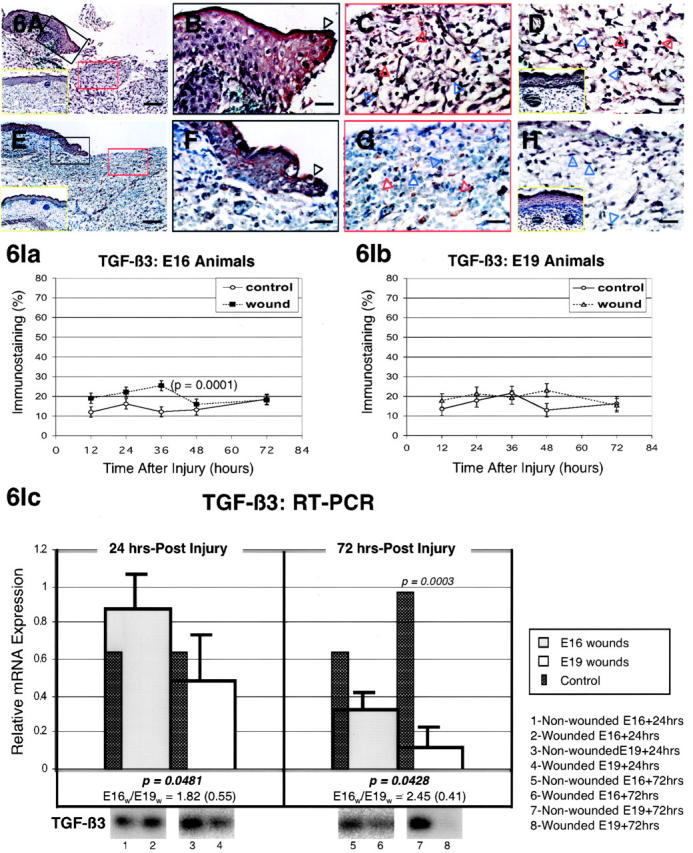
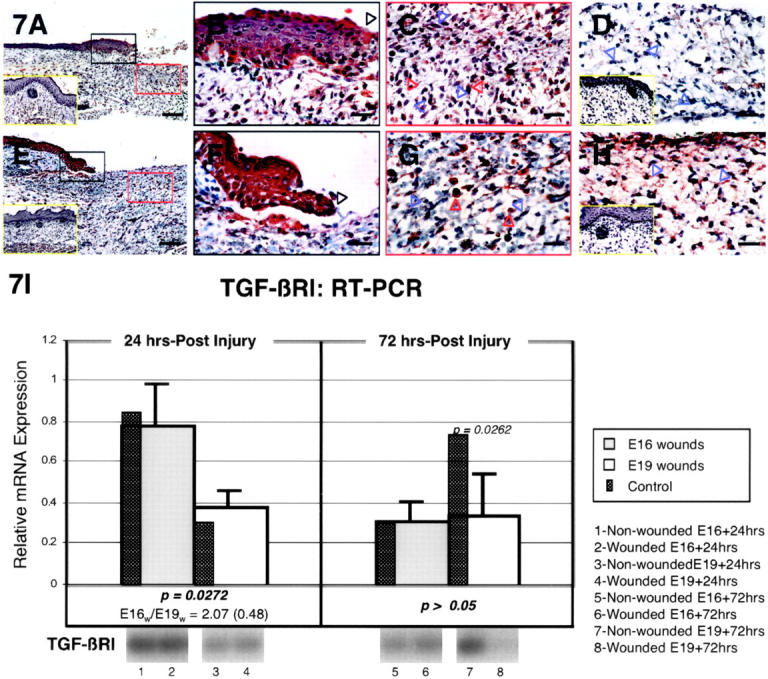
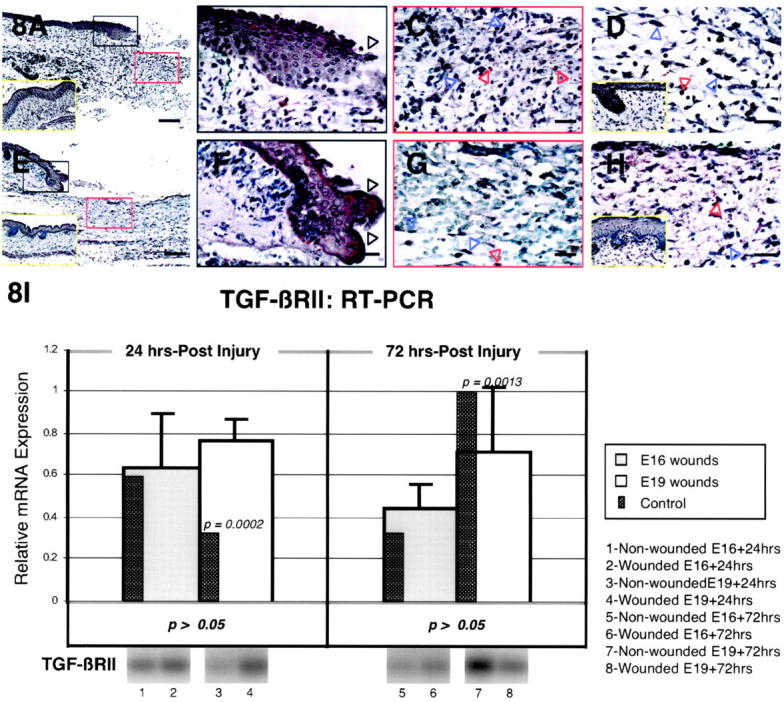
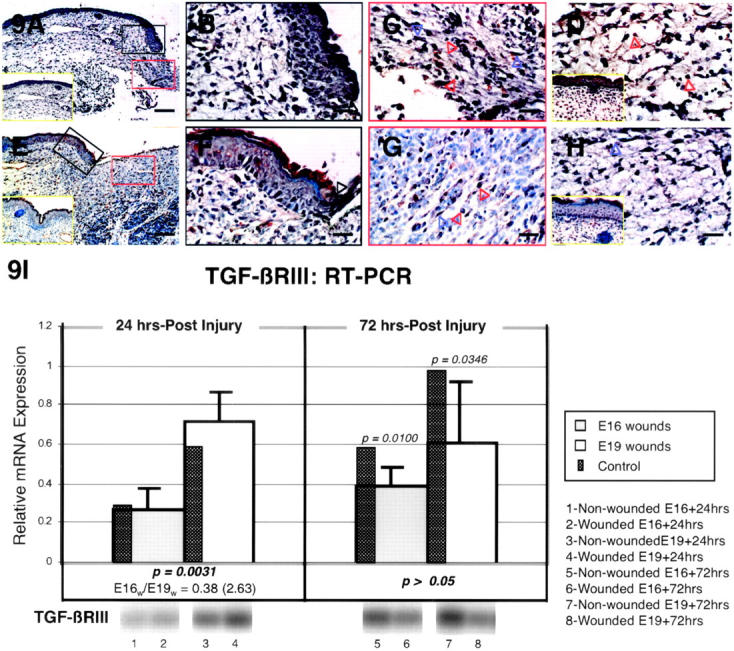
Fetal rat skin transitions from scarless fetal-type repair to adult-type repair with scar between day 16 (E16) and day 18 (E18) of gestation (term = 21.5 days). Deficient transforming growth factor (TGF)-beta 1 and -beta 2 injury response has been proposed as a mechanism for scarless fetal-type repair. However, previous fetal studies have inconsistently reported the degree of TGF-beta induction after injury. To minimize developmental variables in fetal versus adult TGF-beta regulation, we narrowed our study to wounded fetal animals. We hypothesize that TGF-beta ligand and receptor expression will be differentially regulated during the transition from early gestation (E16) wounds manifesting scarless fetal-type repair to late gestation (E19) wounds manifesting adult-type repair with scar. In this study, decreased and rapidly cleared TGF-beta 1 and -beta 2 expression accompanied by increased and prolonged TGF-beta 3 levels in wounded E16 animals correlated with organized collagen deposition. In contrast, increased and prolonged TGF-beta 1 and -beta 2 expression accompanied by decreased and delayed TGF-beta 3 expression in wounded E19 animals correlated with disorganized collagen architecture. Similarly, expression of TGF-beta receptors type I and II were also increased or prolonged in E19 animals. Our results implicate increased TGF-beta 1, -beta 2, and decreased TGF-beta 3 expression, as well as increased type I and II receptor expression in late gestation fetal scar formation.


Figures

Figure 1.
Figure 1.
Operative procedures. A: A small part of the anti-mesenteric surface of the uterus is incised and a purse-string suture is placed around the incision. B and C: A full-thickness wound is created on each embryo by excising a 2-mm disk of tissue. Blue or green vital stain is applied immediately after wounding for later wound identification.
Figure 2.
Figure 2.
H&E stain of wounded E16 rat skin. A: 24 hours post-injury; magnification, ×100. There is minimal inflammatory infiltrate. B: 24 hours post-injury; magnification, ×400. The presence of blue vital dye in hair follicles near the migrating epithelial edge suggests concurrent hair follicle regeneration with wound re-epithelialization (black open arrow). C: 24 hours post-injury; magnification, ×400. Neutrophils (black solid arrows) and lymphocytes (black open arrow) are the predominant cells of the wound periphery and the center of the wound, respectively. D: 72 hours post-injury; magnification, ×100. The wound is entirely healed with complete regeneration of the normal skin architecture. Normal distribution of hair follicles (black open arrows) are observed in the dermis. E: 72 hours post-injury; magnification, ×400. At higher magnification, the previous wound site, as indicated by the presence of blue vital stain in the dermis (black open arrows) is indistinguishable from the non-wounded skin. F: Confocal microscopic view of wounded E16 rat skin and control. (Fa through Fc). Fa: 48 hours post-injury; magnification, ×630. Note the organized appearance of the collagen fibers with a reticular lattice structure. Fb: 72 hours post-injury; magnification, ×630. The wound site is completely re-epithelialized with complete restoration of normal skin collagen architecture and hair follicle regeneration. Fc: Non-wounded E19 skin [ie, E16 + 72 hours]; magnification, ×630. No difference is observed between E16 skin, 72 hours post-wounding, and non-wounded E19 skin. e, epidermis; h, hair follicle; d, dermis. Bars: A and D, 200 μm; B, C, and E, 50 μm; Fa-Fc, 32 μm. G: There is no significant difference in total collagen density between E16 fetuses 72 hours post-injury and non-wounded E19 (E16 + 72 hours) fetuses (P >0.05).
Figure 3.
Figure 3.
H&E stain of wounded E19 rat skin. A: 24 hours post-injury; magnification, ×100. There is moderate inflammatory infiltrate and increased red blood cells. B: 24 hours post-injury; magnification, ×400. Re-epithelialization is also noted at 24 hours after injury (black open arrow). C: 24 hours post-injury; magnification, ×400. Monocytes (black open arrows) comprises most of the inflammatory cells. D: 72 hours post-injury; magnification, ×100. The wound is completely re-epithelialized with increased cellularity and neovascularity. Hair follicles (black open arrows) are not observed in the repaired wound site (far left) compared with unwounded site (far right). E: 72 hours post-injury; magnification, ×400. At higher magnification, blue vital dye (black open arrows) within the repaired wound is visible. F: Confocal microscopic view of wounded E19 rat skin and control. (Fa through Fc). Fa: 48 hours post-injury; magnification, ×630. Large spaces among newly formed collagen fibers within the dermis are noticeable. A thin layer of dense collagen fibers is seen as basement membrane (white open arrows). Fb: 72 hours post-injury, magnification, ×630. Disorganized collagen deposition pattern with heterogeneously sized collagen fibers is apparent in the healed dermal scar tissue. Note the absence of hair follicle regeneration. Fc: Non-wounded neonatal day 1 (N1) skin [ie, E19 + 72 hours, E21 = term]; magnification, ×630. Non-wounded N1 skin exhibited an organized collagen deposition pattern that is significantly different from E19 skin, 72 hours post-wounding. e, epidermis; h, hair follicle; d, dermis. Bars: A and D, 200 μm; B, C, and E, 50 μm; Fa-Fc, 32 μm. G: There is significantly increased total collagen density in wounded E19 fetuses 72 hours post-injury relative to non-wounded N1 controls (P = 0.00043).
Figure 4.
Figure 4.
TGF-β1 expression in wounded E16 and E19 rat skin. A: Immunostained E16 skin, 24 hours post-injury; magnification, ×100. Increased TGF-β1 expression is evident in both wounded epidermal and dermal layers. Non-wounded E17 ]ie, E16 + 24 hours[ control skin is also shown (inset, A, yellow rectangle). B: Immunostained E16 skin, 24 hours post-injury; magnification, ×400. Higher magnification view of wounded epidermis demonstrating strong TGF-β1 staining in both outer and basal as well as migrating (black open arrow) epidermal layers after injury. C: Immunostained E16 skin, 24 hours post-injury; magnification, ×400. Moderately increased TGF-β1 staining is observed in dermal fibroblasts (blue open arrows) as well as the surrounding ECM after wounding. Strong TGF-β1 staining is present in inflammatory cells (red open arrows). D: Immunostained E16 skin, 36 hours post-injury; magnification, ×400. Minimal staining in dermal ECM and fibroblasts (blue open arrows), not significantly different from control, is observed 36 hours after wounding. Non-wounded E17.5 ]ie, E16 + 36 hours[ control skin is also shown (inset, D, yellow rectangle). E: Immunostained E19 skin, 24 hours post-injury; magnification, ×100. Similar to wounded E16 skin, wounded E19 skin also demonstrated increased epidermal and dermal TGF-β1 localization relative to non-wounded control skin. Non-wounded E20 ]ie, E19 + 24 hours[ control skin is also shown (inset, E, yellow rectangle). F: Immunostained E19 skin, 24 hours post-injury; magnification, ×400. Strong epidermal staining is also observed in the migrating (black open arrow) as well as the outer and basal layers after injury. G: Immunostained E19 skin, 24 hours post-injury; magnification, ×400. Inflammatory cells (red open arrows), fibroblasts (blue open arrows), and dermal ECM all demonstrate moderately increased TGF-β1 staining after injury. H: Immunostained E19 skin, 36 hours post-injury; magnification, ×400. In contrast to injured E16 skin, wounded E19 skin demonstrates persistent dermal fibroblast (blue open arrows) and ECM TGF-β1 staining 36 hours after injury. Non-wounded, E20.5 ]ie, E19 + 36 hours[ control skin (inset, H, yellow rectangle) exhibits minimal dermal TGF-β1 staining. Bars: A and E, 200 μm; B–D, F–H, 50 μm. I: Computerized quantitation of dermal TGF-β1 immunostaining in E16- and E19-wounded fetuses. Ia: Dermal TGF-β1 staining is significantly increased in E16 animals 24 hours after wounding relative to non-wounded controls (P = 0.0000). By 36 hours, however, no significant difference was noted between injured animals and controls (P >0.05). Ib: Dermal TGF-β1 staining is significantly increased in E19 animals at 24 hours (P = 0.0000) and at 36 hours (P = 0.0002) after wounding relative to non-wounded controls. Ic: RT-PCR of TGF-β1. The light gray bars represents E16 wounds while the white bars represents E19 wounds at 24 hours (left) and 72 hours (right) after injury. The narrow dark gray bars indicate relative mRNA levels in non-wounded, age-matched controls for each group of wounded animals. A P value, if present, next to the narrow dark gray bars, represents significant differences in relative mRNA expression between wounded E16 or E19 animals and their respective non-wounded controls at 24 and 72 hours post-injury. P values ≥0.05 are not shown. P values for significant differences between wounded E16 and E19 animal mRNA levels at 24 or 72 hours after injury, when present, are shown below the bar graphs as well as the corresponding ratio of E16 to E19 wound mRNA levels (inverse E19 to E16 ratio shown in parentheses). No ratios are shown for values ≥0.05. Also depicted below are representative Southern blots of with non-wounded, age-matched controls (left, odd numbers) and E16 wounds at 24 and 72 hours (2 and 6, respectively) and E19 wounds at 24 and 72 hours (4 and 8, respectively). The top series of blots represents TGF-β1; the bottom GAPDH.
Figure 5.
Figure 5.
TGF-β2 immunostaining of wounded E16 and E19 rat skin. A: E16 skin, 24 hours post-injury; magnification, ×100. Up-regulated TGF-β2 expression is primarily present in epidermal cells and in dermal inflammatory cells. Non-wounded E17 [ie, E16 + 24 hours] control skin is also shown (inset, A, yellow rectangle). B: E16 skin, 24 hours post-injury; magnification, ×400. Strong TGF-β2 staining is present in outer and basal epidermal layers in addition to the migrating epidermis (black open arrow) after injury. C: E16 skin, 24 hours post-injury; magnification, ×400. Inflammatory cells (red open arrows) stain moderately for TGF-β2, while fibroblasts demonstrate minimal (blue open arrows) and ECM exhibit no TGF-β2 staining. D: E16 skin, 36 hours post-injury; magnification, ×400. Minimal TGF-β2 staining that is not significantly different from control is noted in fibroblasts (blue open arrows) and the ECM. Non-wounded E17.5 [ie, E16 + 36 hours] control skin is also shown (inset, D, yellow rectangle). E: E19 skin, 24 hours post-injury; magnification, ×100. Increased epidermal and dermal TGF-β2 localization relative to control skin are noted. Non-wounded E20 [ie, E19 + 24 hours] control skin is also shown (inset, E, yellow rectangle). F: E19 skin, 24 hours post-injury; magnification, ×400. Moderate TGF-β2 staining is present in outer and basal epidermal layers in addition to the migrating epidermis (black open arrow). G: E19 skin, 24 hours post-injury; magnification, ×400. Inflammatory cells (red open arrows), fibroblasts (blue open arrows), and ECM TGF-β2 expression are all increased to moderate levels after injury. H: E19 skin, 36 hours post-injury; magnification, ×400. Wounded E19 skin demonstrate persistent inflammatory cell TGF-β2 staining 36 hours after injury (red open arrows) whereas minimal TGF-β2 staining is observed in fibroblasts (blue open arrows) and the ECM. Non-wounded, E20.5 [ie, E19 + 36 hours] control skin (inset, H, yellow rectangle) exhibit minimal dermal TGF-β2 staining. Bars: A and E, 200 μm; B–D, F–H, 50 μm. I. Computerized quantitation of dermal TGF-β2 immunostaining in E16- and E19-wounded fetuses. Ia: Dermal TGF-β2 staining does not increase significantly in wounded E16 animals at any of the time points studied (P >0.05). Ib: In contrast, dermal TGF-β2 staining increases significantly in E19 animals 24 hours after wounding relative to non-wounded controls (P = 0.0000). Ic: RT-PCR of TGF-β2. Please refer to the Figure 4Ic ▶ legend for an explanation of the bar graphs and representative Southern blot data.
Figure 6.
Figure 6.
TGF-β3 immunostaining of wounded E16 and E19 rat skin. A: E16 skin, 24 hours post-injury; magnification, ×100. Up-regulated TGF-β3 expression is evident in both epidermal and dermal layers after wounding. Non-wounded E17 [ie, E16 + 24 hours] control skin is also shown (inset, A, yellow rectangle). B: E16 skin, 24 hours post-injury; magnification, ×400. Higher magnification view of wounded epidermis demonstrating strong TGF-β3 staining in both outer and basal as well as migrating (black open arrow) epidermal layers. C: E16 skin, 24 hours post-injury; magnification, ×400. Moderate TGF-β3 staining is observed in dermal fibroblasts (blue open arrows) as well as the surrounding ECM. Strong TGF-β3 staining is present in inflammatory cells (red open arrows). This is contrasted with the minimal degree of TGF-β3 staining in control skin (inset, A). D: E16 skin, 36 hours post-injury; magnification, ×400. Persistent TGF-β3 up-regulation is present in inflammatory cells (red open arrows), fibroblasts (blue open arrows), and the ECM 36 hours after wounding. Non-wounded E17.5 [ie, E16 + 36 hours] control skin is also shown (inset, D, yellow rectangle) demonstrating minimal to no TGF-β3 staining for the ECM and fibroblasts, respectively. E: E19 skin, 24 hours post-injury; magnification, ×100. In contrast, to wounded E16 skin, wounded E19 skin does not reveal increased epidermal or dermal TGF-β3 localization when compared with non-wounded control skin. Non-wounded E20 [ie, E19 + 24 hours] control skin is also shown (inset, E, yellow rectangle). F: E19 skin, 24 hours post-injury; magnification, ×400. Minimal intracellular epidermal staining is observed in the migrating (black open arrow) as well as the outer and basal layers. G: E19 skin, 24 hours post-injury; magnification, ×400. Inflammatory cells (red open arrows), fibroblasts (blue open arrows), and dermal ECM does not demonstrate any TGF-β3 up-regulation after injury. H: E19 skin, 36 hours post-injury; magnification, ×400. Wounded E19 skin demonstrate minimal dermal fibroblast (blue open arrows) and ECM TGF-β3 staining 36 hours after injury that is comparable to non-wounded control levels, while inflammatory cells (red open arrows) demonstrate moderately increased staining. Non-wounded, E20.5 [ie, E19 + 36 hours] control skin (inset, H, yellow rectangle) exhibit minimal dermal TGF-β3 staining. Bars: A and E, 200 μm; B–D, F–H, 50 μm. I: Computerized quantitation of dermal TGF-β3 immunostaining in E16- and E19-wounded fetuses. Ia: Dermal TGF-β3 staining is significantly increased in E16 animals 36 hours after wounding relative to non-wounded controls (P = 0.0001). Ib: Dermal TGF-β3 staining does not increase significantly in wounded E19 animals at any of the time points studied (P >0.05). Ic: RT-PCR of TGF-β3. Please refer to the Figure 4Ic ▶ legend for an explanation of the bar graphs and representative Southern blot data.
Figure 7.
Figure 7.
TGF-βRI immunostaining of wounded E16 and E19 rat skin. A: E16 skin, 24 hours post-injury; magnification, ×100. Up-regulated TGF-βRI expression is evident in both epidermal and dermal layers after injury. Non-wounded E17 [ie, E16 + 24 hours] control skin is also shown (inset, A, yellow rectangle). B: E16 skin, 24 hours post-injury; magnification, ×400. Higher magnification view of wounded epidermis demonstrating strong TGF-βRI staining in outer, basal and migrating (black open arrow) epidermal layers. C: E16 skin, 24 hours post-injury; magnification, ×400. Increased TGF-βRI staining from minimal to moderate levels is observed in dermal fibroblasts (blue open arrows) as well as in inflammatory cells (red open arrows) after injury. D: E16 skin, 36 hours post-injury; magnification, ×400. Except for some minimal TGF-βRI up-regulation in inflammatory cells, no epidermal or dermal components demonstrate any TGF-βRI expression above control non-wounded skin. Note the complete absence of TGF-βRI staining in fibroblasts (blue open arrows). Non-wounded E17.5 [ie, E16 + 36 hours] control skin is also shown (inset, D, yellow rectangle). E: E19 skin, 24 hours post-injury; magnification, ×100. Epidermal and dermal TGF-βRI localization is not increased relative to non-wounded control skin. Non-wounded E20 [ie, E19 + 24 hours] control skin is also shown (inset, E, yellow rectangle). F: E19 skin, 24 hours post-injury; magnification, ×400. Moderate epidermal staining is observed in the migrating (black open arrow) as well as the outer and basal layers. G: E19 skin, 24 hours post-injury; magnification, ×400. Inflammatory cells (red open arrows) show moderate TGF-βRI staining whereas fibroblasts (blue open arrows) and dermal ECM demonstrate no staining. H: E19 skin, 36 hours post-injury; magnification, ×400. Wounded E19 skin demonstrate up-regulated TGF-βRI expression in dermal fibroblasts (blue open arrows), inflammatory cells (red open arrows), and ECM. Non-wounded, E20.5 [ie, E19 + 36 hours] control skin (inset, H, yellow rectangle) exhibit minimal dermal TGF-βRI staining. Bars: A and E, 200 μm; B–D, F–H, 50 μm. I. RT-PCR of TGF-βRI. Please refer to the Figure 4Ic ▶ legend for an explanation of the bar graphs and representative Southern blot data.
Figure 8.
Figure 8.
TGF-βRII immunostaining of wounded E16 and E19 rat skin. A: E16 skin, 24 hours post-injury; magnification, ×100. No TGF-βRII up-regulation is observed in comparison with non-wounded E17 [ie, E16 + 24 hours] control skin (inset, A, yellow rectangle). B: E16 skin, 24 hours post-injury; magnification, ×400. Higher magnification view of wounded epidermis demonstrating minimal TGF-βRII staining in outer, basal, and migrating (black open arrows) epidermal layers. C: E16 skin, 24 hours post-injury; magnification, ×400. Minimal TGF-βRII staining is observed in dermal fibroblasts (blue open arrows) as well as inflammatory cells (red open arrows). D: E16 skin, 36 hours post-injury; magnification, ×400. No TGF-βRII staining is observed in dermal ECM and fibroblasts (blue open arrows), whereas moderate staining is seen in inflammatory cells (red open arrow) 36 hours after wounding. Non-wounded E17.5 [ie, E16 + 36 hours] control skin is also shown (inset, D, yellow rectangle). E: E19 skin, 24 hours post-injury; magnification, ×100. Wounded E19 skin demonstrates epidermal TGF-βRII up-regulation in comparison with non-wounded control skin. Non-wounded E20 [ie, E19 + 24 hours] control skin is also shown (inset, E, yellow rectangle). F: E19 skin, 24 hours post-injury; magnification, ×400. Moderate epidermal staining is observed in the migrating (black open arrow) as well as in the outer and basal epidermal layers. G: E19 skin, 24 hours post-injury; magnification, ×400. Inflammatory cells (red open arrow) show minimal TGF-βRII staining whereas fibroblasts (blue open arrows) and dermal ECM demonstrate no staining. H: E19 skin, 36 hours post-injury; magnification, ×400. Dermal up-regulation of TGF-βRII receptor expression is observed solely in inflammatory cells (red open arrow). TGF-βRII receptor staining in fibroblasts (blue open arrow) and the ECM does not differ significantly from control skin. Non-wounded, E20.5 [ie, E19 + 36 hours] control skin (inset, H, yellow rectangle) exhibit minimal dermal TGF-βRII staining. Bars: A and E, 200 μm; B–D, F–H, 50 μm. I: RT-PCR of TGF-βRII. Please refer to the Figure 4Ic ▶ legend for an explanation of the bar graphs and representative Southern blot data.
Figure 9.
Figure 9.
TGF-βRIII immunostaining of wounded E16 and E19 rat skin. A: E16 skin, 24 hours post-injury; magnification, ×100. Dermal TGF-βRIII expression is up-regulated while epidermal expression remain unchanged from non-wounded E17 skin levels [ie, E16 + 24 hours] (inset, A, yellow rectangle). B: E16 skin, 24 hours post-injury; magnification, ×400. Higher magnification view of wounded epidermis demonstrating minimal TGF-βRIII staining in outer, basal, and migrating (black open arrow) epidermal layers. C: E16 skin, 24 hours post-injury; magnification, ×400. Moderate TGF-βRIII staining is observed in dermal fibroblasts (blue open arrows) as well as in the ECM, while minimal staining is demonstrated in inflammatory cells (red open arrows). D: E16 skin, 36 hours post-injury; magnification, ×400. The moderate degree of TGF-βRIII up-regulation in dermal fibroblasts and ECM is not significantly different from non-wounded skin levels, although inflammatory cell (open red arrows) TGF-βRIII expression is increased relative to control E17.5 skin [ie, E16 + 36 hours] (inset, D, yellow rectangle). E: E19 skin, 24 hours post-injury; magnification, ×100. There is no significant difference in TGF-βRIII localization between injured and non-injured control skin. Non-wounded E20 [ie, E19 + 24 hours] control skin is also shown (inset, E, yellow rectangle). F: E19 skin, 24 hours post-injury; magnification, ×400. Similar to control skin, minimal epidermal staining is observed in the migrating (black open arrow) as well as in the outer and basal epidermal layers. G: E19 skin, 24 hours post-injury; magnification, ×400. Inflammatory cells (red open arrows) and dermal ECM for both wounded and non-wounded skin show minimal TGF-βRIII staining whereas fibroblasts (blue open arrow) demonstrate no staining. H: E19 skin, 36 hours post-injury; magnification, ×400. Dermal TGF-βRIII expression does not differ significantly from E20.5 [ie, E19 + 36 hours] control skin (inset, H, yellow rectangle). Bars: A and E, 200 μm; B–D, F–H, 50 μm. I: RT-PCR of TGF-βRIII. Please refer to the Figure 4Ic ▶ legend for an explanation of the bar graphs and representative Southern blot data.

References

    1. Ihara S, Motobayashi Y, Nagao E, Kistler A: Ontogenetic transition of wound healing pattern in rat skin occurring at the fetal stage. Development 1990, 110:671-680 - PubMed
    1. Border WA, Noble NA, Ketteler M: TGF-β: a cytokine mediator of glomerulosclerosis and a target for therapeutic intervention. Kidney Int Suppl 1995, 49:S59-S61 - PubMed
    1. Lin RY, Sullivan KM, Argenta PA, Meuli M, Lorenz HP, Adzick NS: Exogenous transforming growth factor-β amplifies its own expression and induces scar formation in a model of human fetal skin repair. Ann Surg 1995, 222:146-154 - PMC - PubMed
    1. Shah M, Foreman DM, Ferguson MW: Neutralisation of TGF-β 1 and TGF-β 2 or exogenous addition of TGF-β 3 to cutaneous rat wounds reduces scarring. J Cell Sci 1995, 108:985-1002 - PubMed
    1. Shah M, Foreman DM, Ferguson MW: Neutralising antibody to TGF-β 1, 2 reduces cutaneous scarring in adult rodents. J Cell Sci 1994, 107:1137-1157 - PubMed

Publication types

MeSH terms

LinkOut - more resources