. 2003 Dec;163(6):2605-17.
doi: 10.1016/S0002-9440(10)63615-2.

Septic mice are susceptible to pulmonary aspergillosis

Affiliations

Septic mice are susceptible to pulmonary aspergillosis

Claudia F Benjamim et al. Am J Pathol. 2003 Dec.

Abstract

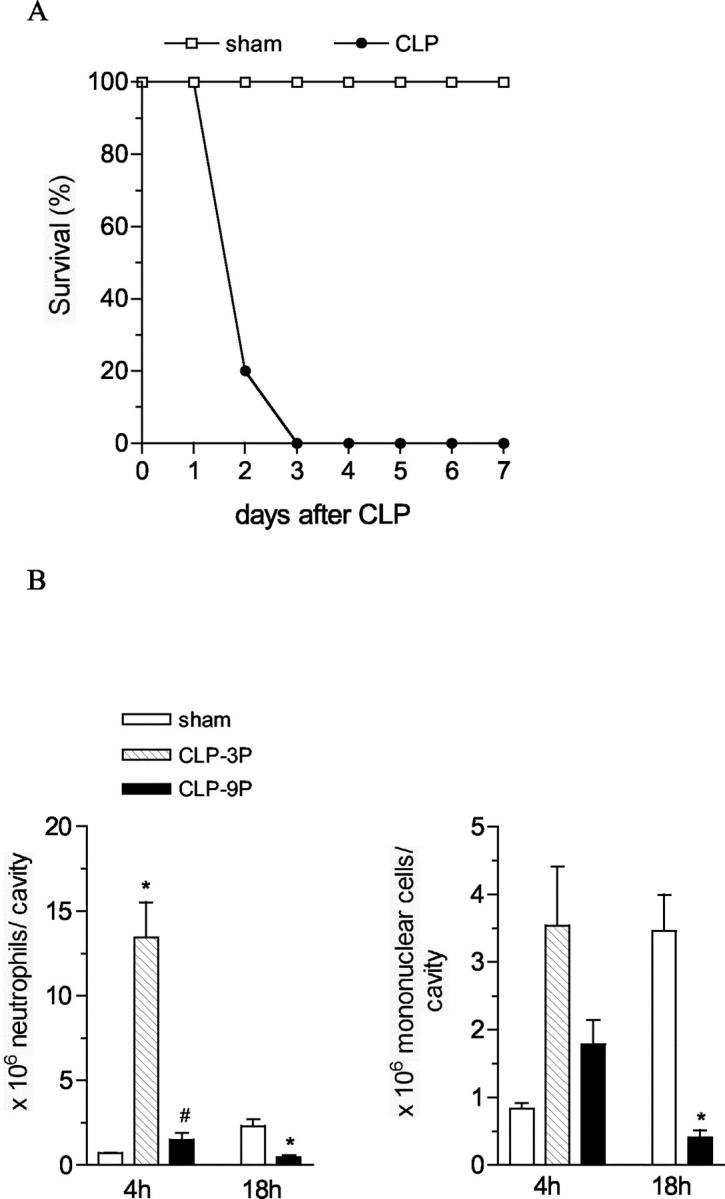
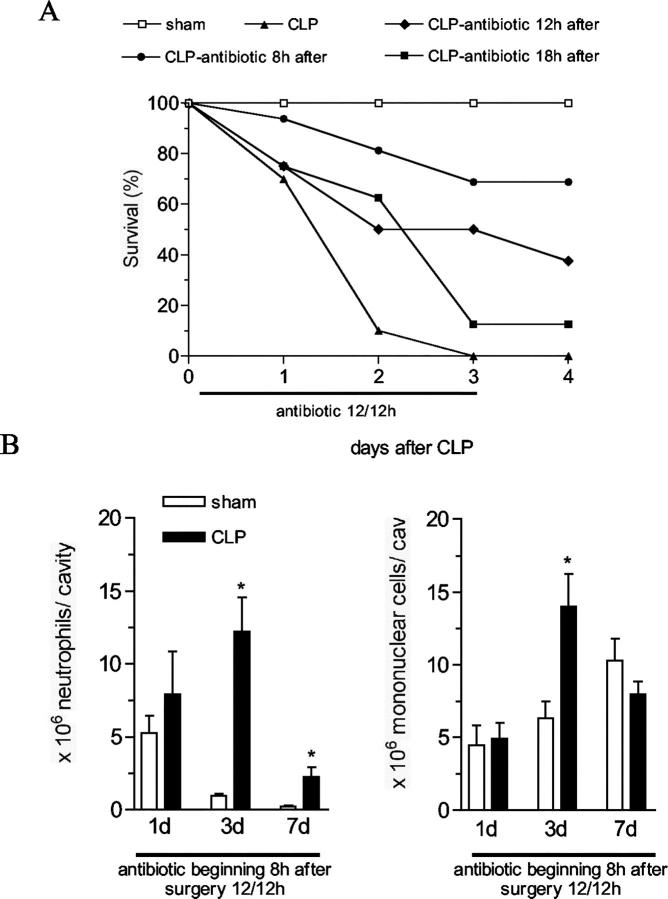
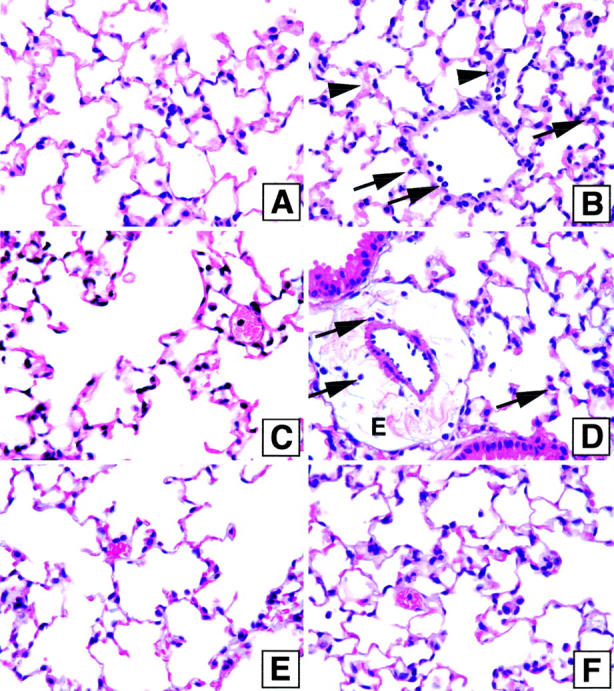
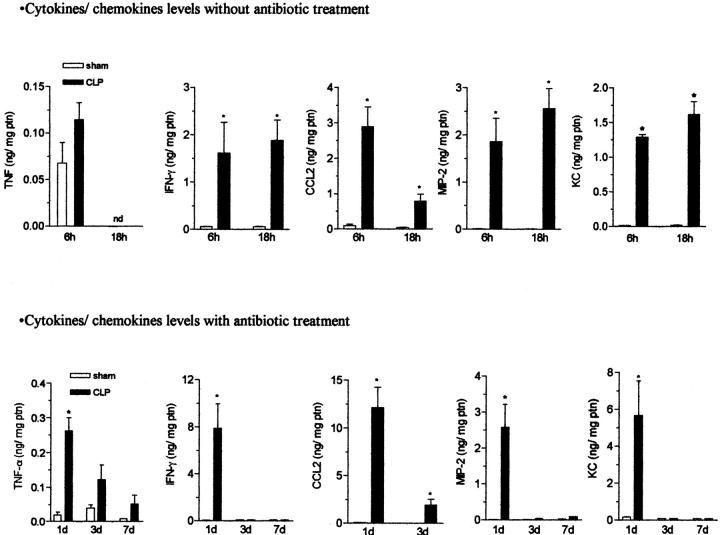
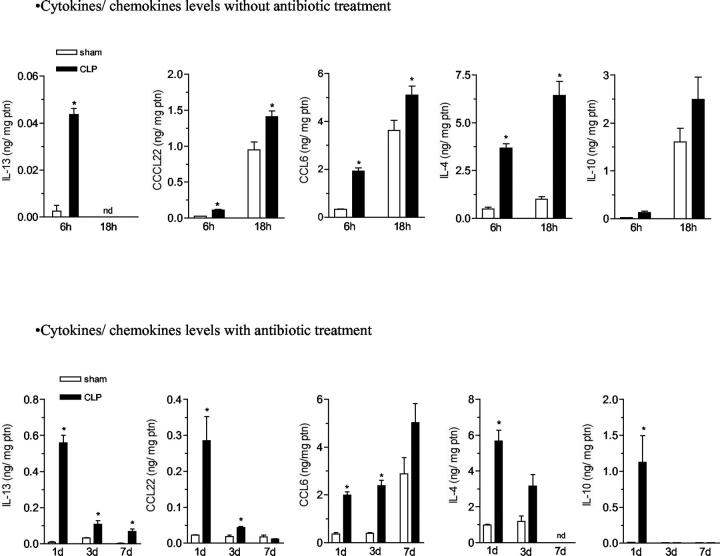
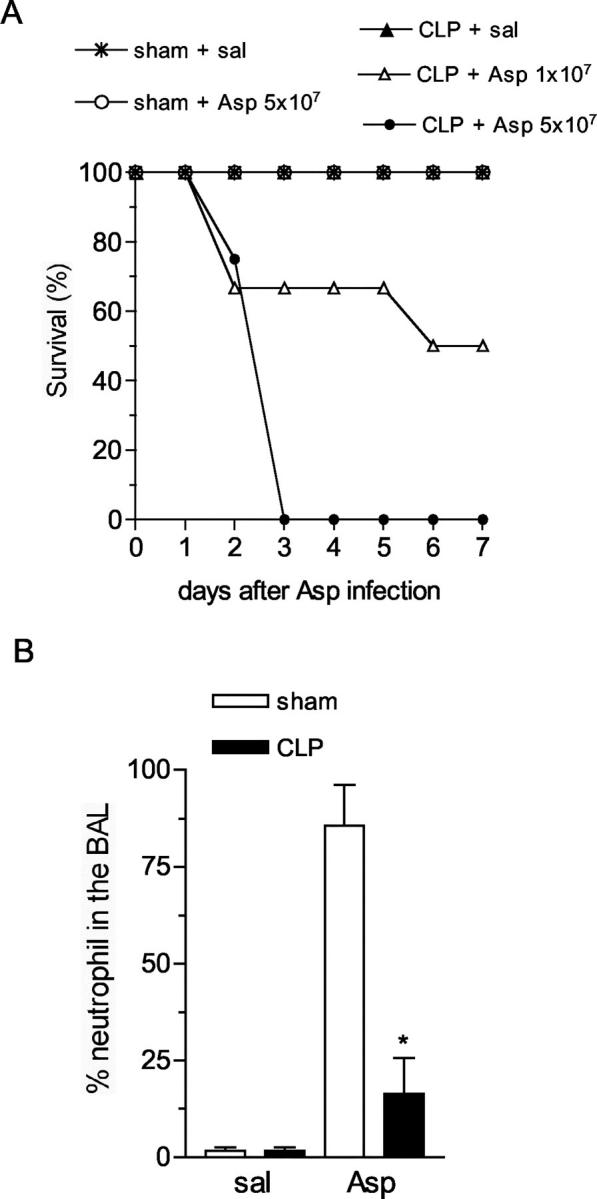
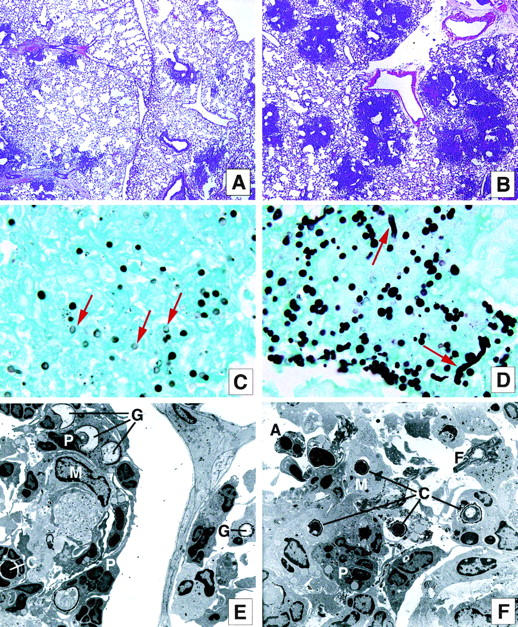
Clinical data underscores the fact that subsequent high mortality rates occur in patients who survive acute septic episodes. Herein, we described a clinically relevant model of experimental sepsis that we believe will allow further investigation of the manner in which the pulmonary innate immune response is modulated after sepsis. C57BL/6 mice were subjected to cecal ligation and puncture (CLP) model, whereby the cecum was partially ligated and punctured nine times with a 21-gauge needle. This procedure was associated with 100% mortality at 3 days after surgery. In contrast, when mice subjected to CLP were treated with antibiotic beginning at 8 hours after surgery, and every 12 hours thereafter until 3 days, approximately 60% of the mice survived. Interestingly, CLP survivors quickly succumbed (100% mortality) to pulmonary infection when intratracheally challenged, at day 3 after CLP, with viable Aspergillus fumigatus conidia. No mortality was observed in conidia-challenged sham-operated mice. The defective innate immune response against A. fumigatus in CLP mice could not be explained by a failure of neutrophils to infiltrate the lungs. Instead, gene array analysis revealed that several components of the innate immune response, including the nuclear factor-kappaB signaling pathway, were down-regulated. Thus, we describe a system of sepsis-induced innate immune failure in the lungs of C57BL/6 mice.


Figures

Figure 1.
Figure 1.
Survival curve and leukocyte migration to the peritoneal cavity in mice subjected to severe sepsis. A: Mice were subjected to CLP or sham operation and the survival of these mice was followed until day 7. The results are expressed as percentage of survival mice per day and each group has 10 mice. The data are representative of four experiments. P < 0.05 as compared with sham-operated mice. B: Mice subjected to CLP with nine punctures (CLP-9P) or with three punctures (CLP-3P) or sham operation were sacrificed 4 or 18 hours after surgery for neutrophil and mononuclear cell migration evaluation The results are expressed as mean ± SEM of cell per cavity, each group has five to eight mice. The data are representative of two experiments. *, P < 0.05 compared to sham-operated mice; #, P < 0.05 compared to CLP-3P group.
Figure 2.
Figure 2.
Survival curve and leukocyte migration to the peritoneal cavity in mice subjected to CLP and treated with antibiotic. A: Mice received an intraperitoneal injection of antibiotic Imipenem (200 μg/0.2 ml/mouse) 8, 12, or 18 hours after CLP surgery, and then every 12 hours until day 3 after surgery. Mouse survival was followed until day 4, and the results were expressed as survival percentage, each group has 10 mice. The data are representative of three experiments. P < 0.05 between CLP antibiotic 8-hour group and CLP without antibiotic treatment group. B: Mice were subjected to sham or CLP surgery and received antibiotic 8 hours after, and then every 12 hours until day 3. Neutrophil and mononuclear cell recruitment to peritoneal cavity was evaluated at 1, 3, and 7 days after surgery. The results are expressed as mean ± SEM, each group has five to eight mice. The data are representative of three experiments. *, P < 0.05 compared to sham-operated group.
Figure 3.
Figure 3.
Lung histology in mice subjected to sham or CLP surgery with and without antibiotic treatment. Mice were sacrificed 6 (A and B) and 18 hours (C and D) after sham (A and C) and CLP (B and D) surgery without antibiotic treatment. Sham (E) and CLP (F) groups treated with antibiotic were sacrificed 3 days after surgery. The lungs were perfused with formalin 10% by trachea, harvested, cut, embedded in paraffin, and stained with H&E. The arrowheads indicate the alveolar wall, which is thickened, and the arrows indicate neutrophil infiltration (B and D), edema (D). The histology shown is representative of three separate experiments, with five mice in each group.
Figure 4.
Figure 4.
The effect of sham or CLP surgery on lung levels of TNF-α, interferon-γ, CCL22, MIP-2, and KC in mice with or without antibiotic therapy. Sham- and CLP-operated mice that did not receive antibiotic treatment were sacrificed 6 and 18 hours (top) after surgery, whereas sham- and CLP-operated mice that received antibiotic treatment (bottom) were sacrificed 1, 3, and 7 days after surgery. The left lung was collected and snap-frozen for ELISA assay. The results are expressed as mean ± SEM of ng of cytokine/chemokine per mg of protein, each group has five to six mice and the data are representative of two experiments. *, P < 0.05 compared to sham-operated group.
Figure 5.
Figure 5.
The effect of sham and CLP surgery on lung levels of IL-13, CCL22, CCL6, IL-4, and IL-10 in mice with or without antibiotic therapy. Sham- and CLP-operated mice that did not receive antibiotic treatment were sacrificed 6 and 18 hours (top) after surgery, whereas sham- and CLP-operated mice that received antibiotic treatment (bottom) were sacrificed 1, 3, and 7 days after surgery. The left lung was collected and snap-frozen for ELISA assay. The results are expressed as mean ± SEM of ng of cytokine/chemokine per mg of protein, each group has five to six mice and the data are representative of two separate experiments. *, P < 0.05 compared to sham-operated group. Nd, not determined.
Figure 6.
Figure 6.
Survival curve and neutrophil migration into the BAL of sham or CLP-operated mice challenged with A. fumigatus. A: On the third day after sham or CLP surgery and antibiotic treatment, groups of mice either received an intratracheal injection of 30 μl of saline (control group) or 5 × 10⁷ conidia of A. fumigatus (Asp) in 30 μl of saline. Only the CLP surgery group received 1 × 10⁷ conidia. These mice were monitored for 7 days. Survival results are expressed as percentage of surviving mice per day, and each group started with 10 mice. The data are representative of three separate experiments. P < 0.05, CLP plus Asp 1 × 10⁷ and CLP plus Asp 5 × 10⁷ compared to CLP plus saline. B: On the third day after sham or CLP surgery and antibiotic treatment, both groups of mice were subjected to an intratracheal injection of 5 × 10⁷ of A. fumigatus conidia. The animals were sacrificed 6 hours after saline or conidia challenge and BAL was performed to evaluate the cell population. The results are expressed as a percentage of neutrophils in the BAL, and each group has six to eight mice. *, P < 0.05 compared to sham group challenged with conidia. The data are representative of three separate experiments.
Figure 7.
Figure 7.
Leukocyte infiltration and the presence of A. fumigatus conidia and hyphae in the lung of mice subjected to sham or CLP surgery and challenged with fungus. A and B: Sham (A) and CLP (B) mice were injected intratracheally with 5 × 10⁷ conidia of A. fumigatus, sacrificed 2 days after this challenge, and the lung tissue was harvested and processed to evaluate the inflammatory response by H&E stain. The histology shown is representative of three separate experiments, with five mice in each group. C and D: High-power magnification of the inflammatory sites of the lung in the day 2 after conidia challenge in sham (C) and CLP (D) mice. The slides were stained with Gomori methanamine silver to evaluate the presence of conidia and hyphae (black dotsarrowheads indicate ghost conidia in C and hyphae growth in D). The histology shown is representative of three separate experiments with five mice in each group. E and F: Electron micrographs of lungs obtained 2 days after conidia challenge in the sham (E) and CLP groups (F). G, Ghost conidia; C, intact conidia; M, macrophage; P, neutrophil; A, apoptotic cell; F, fibrin. The electron micrograph shown is representative of two separate experiments, with three mice in each group. Original magnifications: ×40 (A and B); × 1000 (C and D); ×2600 (E and F).
Figure 8.
Figure 8.
The effect of sham and CLP surgery on whole lung levels of CCL6 and IL-10 in mice subjected to CLP and challenged with A. fumigatus conidia. Sham- and CLP-operated mice treated with antibiotic were sacrificed 6 hours after A. fumigatus conidia challenge and the left lung was collected and snap-frozen for ELISA assay for CCL6 and IL-10. The results are expressed as mean ± SEM of ng of cytokine/chemokine per mg of protein, each group has five to six mice and the data are representative of two separate experiments. *, P < 0.05 compared to sham-operated group.

Similar articles

Cited by

References

    1. Perl TM, Dvorak L, Hwang T, Wenzel RP: Long-term survival and function after suspected Gram-negative sepsis. JAMA 1995, 274:338-345 - PubMed
    1. Bone RC: Gram-negative sepsis. Background, clinical features, and intervention. Chest 1991, 100:802-808 - PubMed
    1. Martin MA: Epidemiology and clinical impact of gram-negative sepsis. Infect Dis Clin North Am 1991, 5:739-752 - PubMed
    1. Walley KR, Lukacs NW, Standiford TJ, Strieter RM, Kunkel SL: Balance of inflammatory cytokines related to severity and mortality of murine sepsis. Infect Immun 1996, 64:4733-4738 - PMC - PubMed
    1. Hotchkiss RS, Tinsley KW, Swanson PE, Grayson MH, Osborne DF, Wagner TH, Cobb JP, Coopersmith C, Karl IE: Depletion of dendritic cells, but not macrophages, in patients with sepsis. J Immunol 2002, 168:2493-2500 - PubMed

Publication types

MeSH terms