. 2003 Dec 1;17(23):2875-88.
doi: 10.1101/gad.1109003. Epub 2003 Nov 21.

Structural and biochemical analyses of DNA and RNA binding by a bifunctional homing endonuclease and group I intron splicing factor

Affiliations

Structural and biochemical analyses of DNA and RNA binding by a bifunctional homing endonuclease and group I intron splicing factor

Jill M Bolduc et al. Genes Dev. .

Abstract

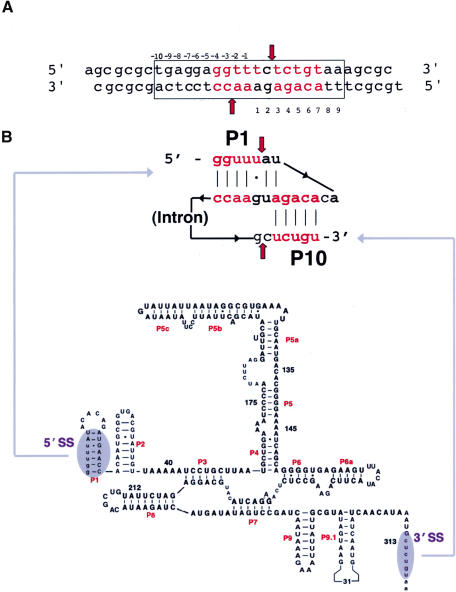
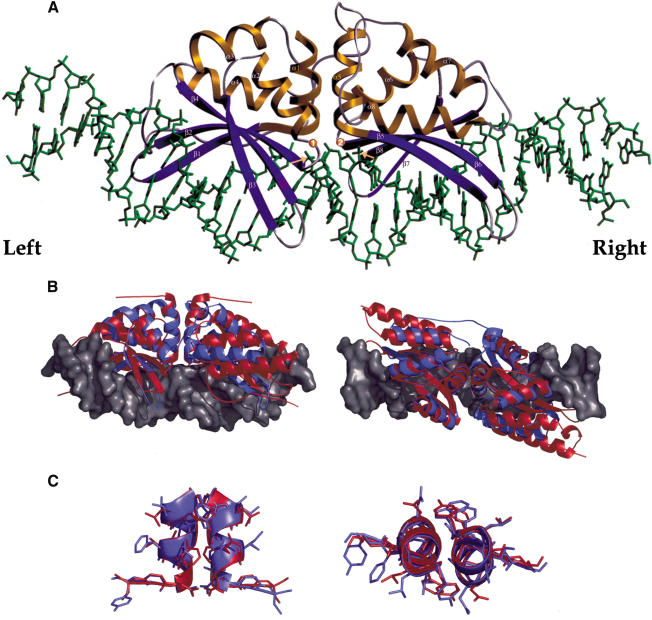
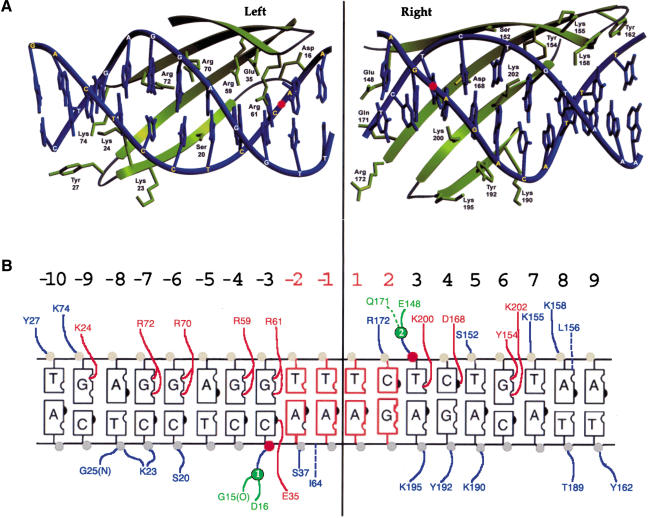
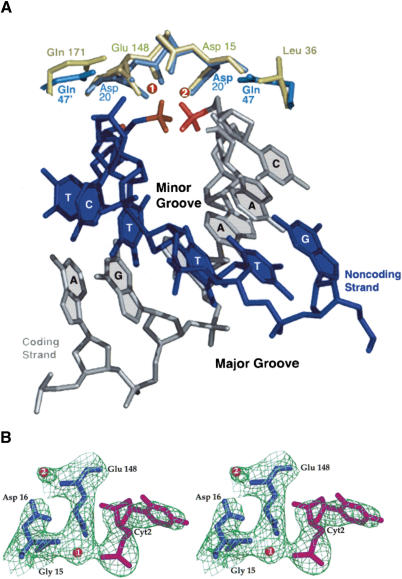
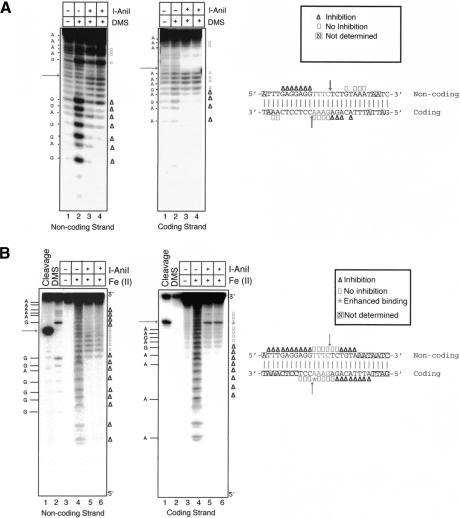
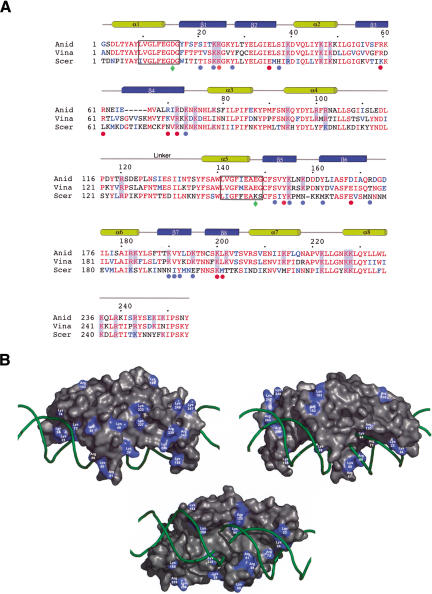
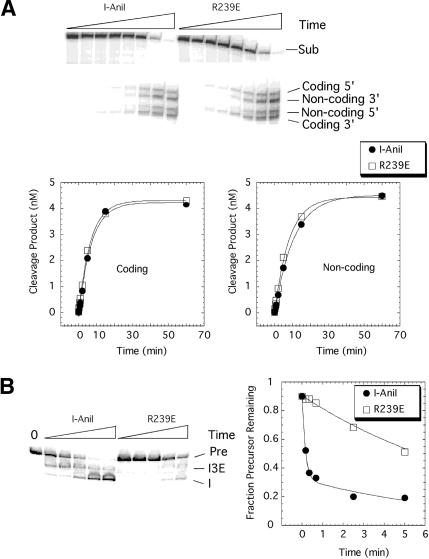
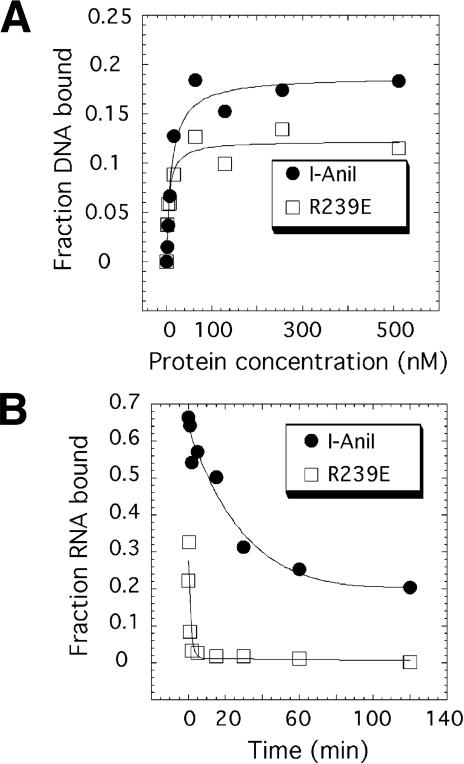
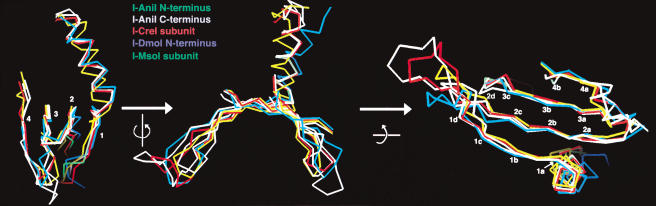
We determined the crystal structure of a bifunctional group I intron splicing factor and homing endonuclease, termed the I-AniI maturase, in complex with its DNA target at 2.6 A resolution. The structure demonstrates the remarkable structural conservation of the beta-sheet DNA-binding motif between highly divergent enzyme subfamilies. DNA recognition by I-AniI was further studied using nucleoside deletion and DMS modification interference analyses. Correlation of these results with the crystal structure provides information on the relative importance of individual nucleotide contacts for DNA recognition. Alignment and modeling of two homologous maturases reveals conserved basic surface residues, distant from the DNA-binding surface, that might be involved in RNA binding. A point mutation that introduces a single negative charge in this region uncouples the maturase and endonuclease functions of the protein, inhibiting RNA binding and splicing while maintaining DNA binding and cleavage.


Figures

Figure 1.
Figure 1.
(A) Sequence of the DNA target site for I-AniI and the design of the oligonucleotide construct used for the structure determination. Cleavage sites are indicated by arrows; red bases indicate those similar to their aligned counterparts in the RNA splice junctions (panel B). (B) Schematic representation of A.n.COBme pre-RNA secondary structure around the 5′ and 3′ splice sites. The P1/P10 pseudoknot is highlighted. Arrows point to the splice sites. The sequence and predicted secondary structure of the A.n.COB intron is shown below for reference.
Figure 2.
Figure 2.
(A) Ribbon diagram of I-AniI maturase bound to its target DNA site. The left and right halfsites are noted here and in Figure 3 as described in the text. The bound magnesium ions are shown here as spheres labeled “1” and “2” (also in Figs. 3, 4). Adjacent scissile phosphates are indicated by orange arrows. (B) Backbone trace of I-AniI (blue ribbons) bound to its DNA target (gray space-filled model) superimposed against backbone ribbon of I-CreI (red ribbons). (C) Superposition of LAGLIDADG helices of I-AniI (blue) and I-CreI (red). Panel A and Figure 3A were made with the program SETOR (Evans 1993); panels B and C and Figures 5 and 7 were made with the program PYMOL (DeLano 2002).
Figure 3.
Figure 3.
DNA recognition and contacts by I-AniI. (A) Ribbon diagram of DNA-binding β-strands and their side chains in each DNA target halfsite. Cleavage sites are indicated by red spheres. (B) Schematic representation of direct protein interactions to nucleotide base pairs and the phosphate backbone in the DNA interface. Bound metal ions are shown as green spheres as in Figures 2 and 4. Colors represent contacts to phosphate backbone (blue), to nucleotide bases (red), and to divalent metal ions (green).
Figure 4.
Figure 4.
Structure of I-AniI active sites. (A) Superposition of active-site residues of I-AniI (gold) and I-CreI (light blue). Bound metals from the I-AniI complex are shown as green spheres; coding and noncoding DNA strands are shown in gray and dark blue, respectively. The four central bases at the cleavage site and a single flanking base to each side are shown for each DNA strand. The view is looking straight through the minor groove, which is significantly narrowed due to the negative roll angles for these bases. The scissile phosphates, which are ∼5 Å apart, are shown in red. (B) Experimental SAD electron density. Both bound metal ions and the two conserved LAGLIDADG acidic residues (Asp 16 and Glu 148) are shown, as well as the 3′ base of one strand with a cleaved phosphate (in contact with magnesium 1). The third oxygen of the free phosphate is pointing away from the viewer and is not visible.
Figure 5.
Figure 5.
(A) DMS modification interference analysis. Oligonucleotides of either the coding or noncoding strand were 5′-end-labeled and hybridized to the corresponding unlabeled DNA strand, modified with DMS, and incubated with limiting concentrations of I-AniI. Bound DNAs were recovered by nitrocellulose filter binding. Modifications that inhibit binding are indicated by gaps in the cleavage patterns relative to the minus I-AniI lane. The red arrow demarcates the I-AniI cleavage product. The data are summarized schematically to the right. (Lane 1) Untreated target-site DNA. (Lane 2) DMS-treated target-site DNA. (Lane 3) Target-site DNA (1 μM) bound to 0.75 μM I-AniI. (Lane 4) Target-site DNA (1 μM) bound to 0.375 μM I-AniI. (B) Hydroxyl radical nucleoside deletion analysis. Oligonucleotides of either the coding or noncoding strand were 5′-end-labeled and hybridized to the corresponding unlabeled DNA strand, cleaved by hydroxyl radicals, and incubated with limiting concentrations of I-AniI; bound DNAs were recovered by nitrocellulose filter binding. Modifications that inhibit binding are indicated by gaps in the cleavage patterns relative to the minus I-AniI lane. The red arrow demarcates the I-AniI cleavage product. The data are summarized schematically to the right. (Lane 1) I-AniI cleavage of target-site DNA. (Lane 2) Sequencing markers derived from DMS-treated DNA. (Lane 3) Untreated target-site DNA. (Lane 4) Hydroxyl radical-treated target-site DNA. (Lane 5) Target-site DNA (405 nM) bound to 500 nM I-AniI. (Lane 6) Target-site DNA (405 nM) bound to 250 nM I-AniI.
Figure 6.
Figure 6.
(A) Sequence alignment of proteins encoded by the third intron of the apocytochrome b gene in S. cerevisiae (Sccobi3; Scer; Lazowska et al. 1989) and the fifth intron of the same gene in V. inaequalis (Vicobi5; Vina;Zheng and Koller 1997) with the I-AniI maturase. The secondary structure of I-AniI is indicated above the aligned sequences; conserved basic residues in the aligned sequences are highlighted. The LAGLIDADG signatures are outlined with boxes; the residue from each signature involved in binding a catalytic metal ion is indicated with a green diamond. Residues that contact DNA nucleotide bases are indicated with red dots, and residues that contact DNA phosphate backbone are indicated with blue dots. (B) Solvent-accessible surface of I-AniI colored to indicate positions of basic surface residues conserved between I-AniI and Vicobi5/Sccobi3 maturases (alignment shown in Fig. 1B). The protein surface is shown from both sides (top and middle panels) and from the bottom (the DNA-binding surface, bottom panel). Note that one side and end of the protein surface is populated with conserved basic residues that are not involved in DNA contacts, including Lys 46, Lys 183, Lys 222, Lys 227, Lys 236, Lys 247, Lys 249, Arg 239, and Arg 243.
Figure 7.
Figure 7.
Endonuclease and splicing activity of wild-type vs. R239E I-AniI. (A) Endonuclease assay. Double-stranded cleavage of an internally radiolabeled 200-bp DNA (3 nM) containing the I-AniI binding site was initiated by the addition of wild-type or mutant protein (200 nM), and aliquots of the reactions were stopped by organic extraction; the products were separated by gel electrophoresis (Chatterjee et al. 2003). Plots of the coding and noncoding strand cleavage are shown below. Two independent experiments gave average rates for coding strand cleavage of 0.13 min-1 (range 0.14-0.11 min-1) and 0.13 (range 0.15-0.11 min-1) for the wild-type and R239E, respectively. Likewise, average rates for noncoding strand cleavage were 0.09 (range 0.09-0.09 min-1) and 0.1 (range 0.12-0.08 min-1) for the wild-type and R239E. (Sub) Substrate. (B) Splicing assay. Splicing of radiolabeled COBme-pre-RNA (0.07 nM) was initiated by the addition of wild-type or mutant protein (500 nM), and aliquots of the reactions were stopped by organic extraction; the products were separated by gel electrophoresis (Solem et al. 2002). A plot of the data is shown to the right. Two independent experiments gave average splicing rates of 3 min-1 (range 2-4 min-1) and 0.15 (range 0.2-0.1 min-1) for the wild-type and R239E, respectively. (Pre) Precursor;(I3E) intron-3′exon intermediate;(I) free intron; (0) zero time point.
Figure 8.
Figure 8.
DNA and RNA intron target-site binding of R239E. (A) Equilibrium binding for DNA target site. Trace amounts of radiolabeled DNA were incubated with a range of protein concentrations and filtered through nitrocellulose. Two independent experiments gave average equilibrium constants (Kd) of 11 nM (range 9-13 nM) and 7 nM (range 6-8 nM) for the wild-type and R239E, respectively. (B) Dissociation of protein/COBme-pre-RNA complexes. The rate of dissociation was measured by diluting the protein/radiolabeled RNA complexes into buffer containing an 800-molar excess of unlabeled COBme-pre-RNA, and aliquots were withdrawn and filtered through nitrocellulose at the times indicated. Two independent experiments gave average dissociation rates of 0.02 min-1 (range 0.01-0.02 min-1) and 0.7 min-1 (range 0.7-0.7 min-1) for the wild-type and R239E, respectively.
Figure 9.
Figure 9.
Superposition of β-sheet DNA binding motifs for five independent LAGLIDADG domains and subunits, from their DNA-bound structures: subunits from I-CreI and I-MsoI, the N-terminal domain from I-DmoI, and the N- and C-terminal domains from I-AniI. Cα positions corresponding to residues side chains that interact with the DNA target, and that superimpose closely (less than 1 Å rmsd each) are labeled.

Comment in

Similar articles

Cited by

References

    1. Argast G.M., Stephens, K.M., Emond, M.J., and Monnat, R.J. 1998. I-PpoI and I-CreI homing site sequence degeneracy determined by random mutagenesis and sequential in vitro enrichment. J. Mol. Biol. 280: 345-353. - PubMed
    1. Bassi G.S., Oliveira, D.M.D., White, M.F., and Weeks, K.M. 2002. Recruitment of intron-encoded and co-opted proteins in splicing of the bI3 group I intron RNA. Proc. Natl. Acad. Sci. 99: 128-133. - PMC - PubMed
    1. Belfort M. and Perlman, P.S. 1995. Mechanisms of intron mobility. J. Biol. Chem. 270: 30237-30240. - PubMed
    1. Belfort M. and Roberts, R.J. 1997. Homing endonucleases—Keeping the house in order. Nucleic Acids Res. 25: 3379-3388. - PMC - PubMed
    1. Brunger A. 1993. Assessment of phase accuracy by cross validation: The free R value. Methods and Applications. Acta Cryst. D49: 24-36. - PubMed

Publication types

LinkOut - more resources