. 2003 Dec 1;22(23):6267-76.
doi: 10.1093/emboj/cdg599.

Osteocyte control of bone formation via sclerostin, a novel BMP antagonist

Affiliations

Osteocyte control of bone formation via sclerostin, a novel BMP antagonist

David G Winkler et al. EMBO J. .

Abstract

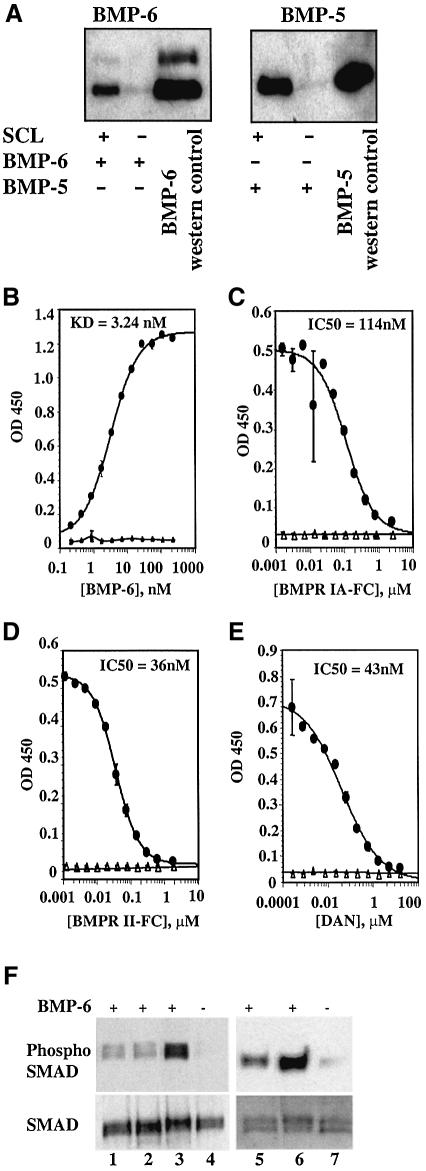
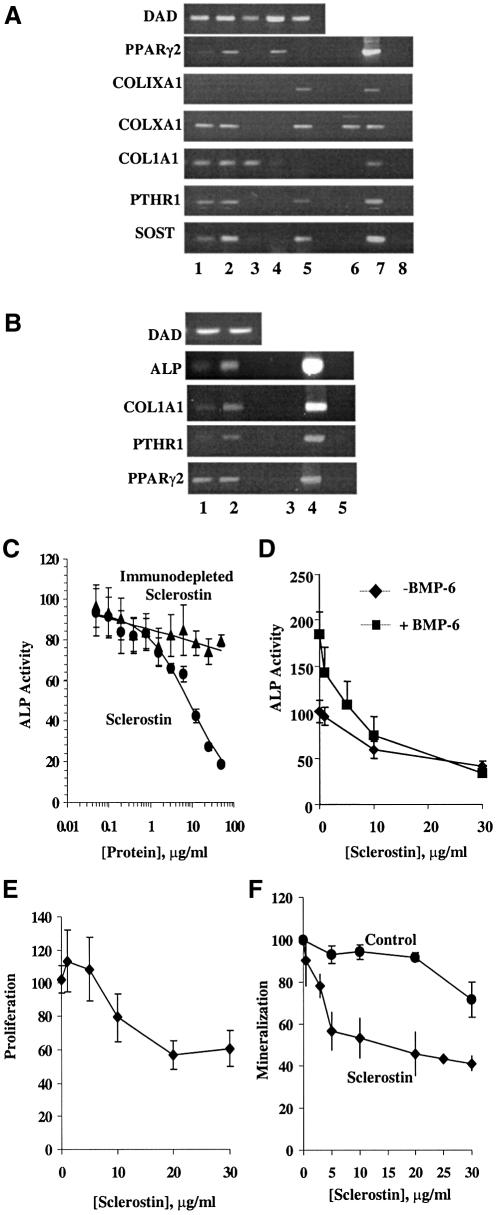
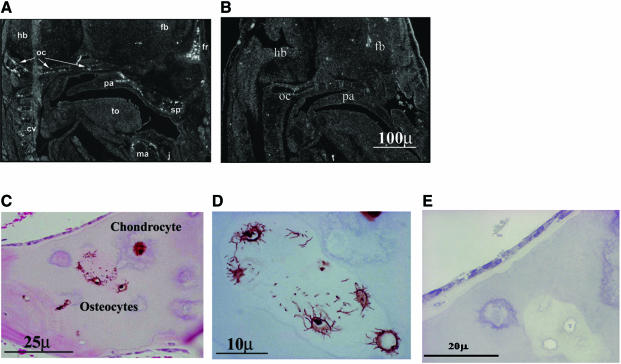
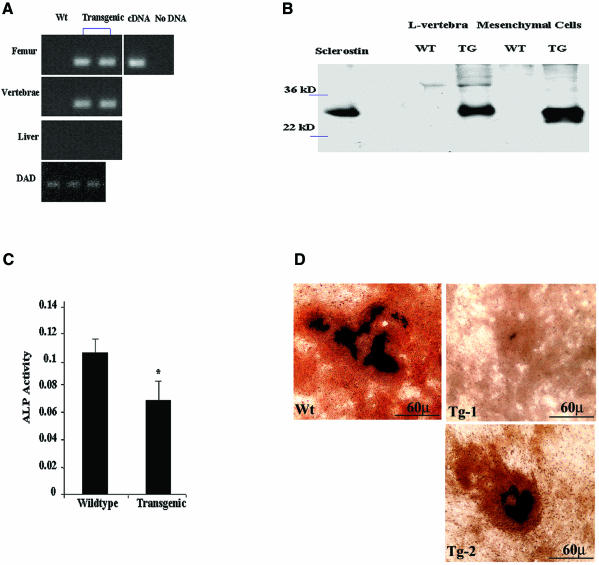
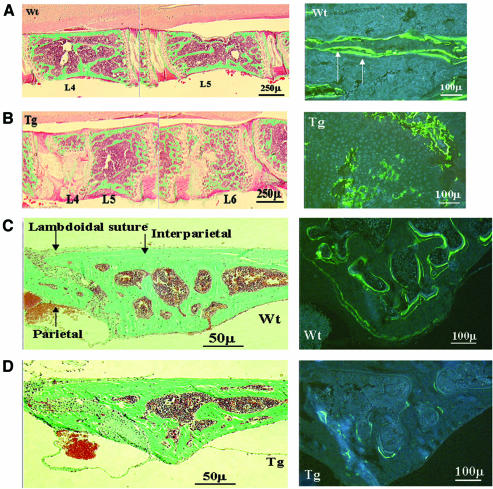
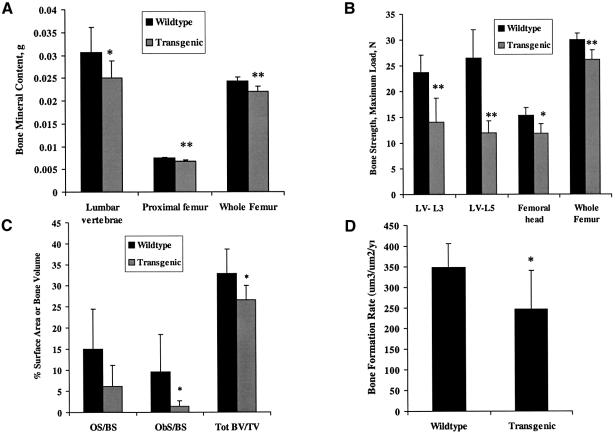
There is an unmet medical need for anabolic treatments to restore lost bone. Human genetic bone disorders provide insight into bone regulatory processes. Sclerosteosis is a disease typified by high bone mass due to the loss of SOST expression. Sclerostin, the SOST gene protein product, competed with the type I and type II bone morphogenetic protein (BMP) receptors for binding to BMPs, decreased BMP signaling and suppressed mineralization of osteoblastic cells. SOST expression was detected in cultured osteoblasts and in mineralizing areas of the skeleton, but not in osteoclasts. Strong expression in osteocytes suggested that sclerostin expressed by these central regulatory cells mediates bone homeostasis. Transgenic mice overexpressing SOST exhibited low bone mass and decreased bone strength as the result of a significant reduction in osteoblast activity and subsequently, bone formation. Modulation of this osteocyte-derived negative signal is therapeutically relevant for disorders associated with bone loss.


Figures

None
Fig. 1. Sclerostin is a BMP antagonist. (A) Co-immunoprecipitation of BMP-5 and BMP-6 with human sclerostin (SCL). (B) BMP-6 binding to human sclerostin (circles) or a BSA-blocked plate (triangles) in an ELISA-based association assay. (C) BMPRIA–FC competed with human sclerostin for BMP-6 binding. (D) BMPR II–FC competed with human sclerostin for BMP-6 binding. (E) The DAN BMP antagonist competed with human sclerostin for BMP-6 binding. (F) Inhibition of BMP-6-induced SMAD phosphorylation by human sclerostin. SMAD levels were constant in these lysates (anti-SMAD 1 and 5). Lane 1, treatment with anti-BMP-6 antibody; lane 2, BMPR1A–FC, lanes 3 and 4, no competitor added; lane 5, sclerostin; and lanes 6 and 7, no competitor added.
None
Fig. 2. SOST is expressed by osteoblasts. Sclerostin, the SOST gene product, decreased osteoblastic activity. (A) Expression of SOST in osteoblasts. RT–PCR analyses of RNA isolated from cultures of primary human osteoblasts (lane 1), hMSCs differentiated in culture to osteoblasts (lane 2), undifferentiated hMSCs (lane 3), abdominal adipose tissue (lane 4) and cartilage tissue (lane 5). PCR controls are shown in lanes 6 (genomic DNA), 7 (cDNA) and 8 (no DNA added). DAD served as a control for RNA loading. (B) Human sclerostin decreased the expression of osteoblastic phenotypic markers (ALP, COL1A1 and PTHR1) in hMSCs grown in osteogenic medium. Lane 1, sclerostin-treated; 1ane 2, control protein preparation from Sf9 cells; PCR controls are shown in lanes 3 (genomic DNA), 4 (cDNA) and 5 (no DNA added). Sclerostin had no effect on non-osteoblastic markers such as PPARγ2. (C) Human sclerostin antagonized BMP-6-induced ALP activity in C3H10T1/2 cells. Sclerostin immunodepleted with an anti-FLAG antibody had no significant effects on BMP-6 stimulated ALP activity. Activity was expressed as mean ± SD, % activity in vehicle-treated cells (vehicle = 0.984 ± 0.201 OD405/mg protein/30 min). (D) Human sclerostin antagonized the basal and BMP-6-induced ALP activities in hMSCs in a dose-dependent manner (ANOVA, P < 0.0001). Data shown represent mean ± SD, % activity in vehicle-treated cells (vehicle = 2.07 ± 0.21 OD/mg protein/5 min). (E) Human sclerostin significantly decreased the proliferation of hMSCs cultured in osteogenic medium as determined by [3H]thymidine uptake (ANOVA, P < 0.01). Proliferation expressed as mean ± SD, % vehicle-treated cells (vehicle = 5806 ± 1300 c.p.m. per well). (F) Human sclerostin, but not the control Sf9 protein preparation, inhibited the mineralization of hMSCs grown in osteogenic medium in a dose-dependent manner (Kruskal–Wallis, P < 0.0005). Data shown represent the mean ± SD of mineralization (% vehicle, vehicle = 186.93 ± 75.96 µg calcium/mg protein).
None
Fig. 3. Localization of the expression of SOST and sclerostin in murine and human bone tissues. (AIn situ analysis of SOST expression in 15.5-day-old mouse embryo. Hybridization with antisense RNA probes to SOST in the mouse embryo showed specific expression in the occipital (oc), frontal (fr) and sphenoid (sp) ossifying cartilages as well as the mandible (ma), palatal shelf of the maxilla (pa) and the cervical vertebrae (cv). (hb = hindbrain; fb = forebrain; j = jaw) (B) No signal was observed with the sense probe. (C) Immunohistochemical staining of normal adult human bone with a rabbit anti-human sclerostin antibody showed positive staining in osteocytes, osteocytic canaliculi and/or cell processes, and hypertrophic chondrocytes. H&E counterstain. (D) High power magnification of osteocytes and their cell processes/canaliculi in human bone that stain positive for sclerostin. (E) No staining for sclerostin was found using a rabbit IgG control antibody.
None
Fig. 4. Sclerostin-transgenic mice express SOST and sclerostin. (A) RT–PCR analyses of RNA isolated from femurs, lumbar vertebrae and liver of wild-type (Wt) littermates and transgenic mice. Bones from transgenic mice expressed the SOST transgene. DAD served as loading control. (B) Western blot analyses of protein extracts prepared from lumbar vertebrae and mesenchymal cells of wild-type (WT) and transgenic (TG) mice. Human sclerostin protein was expressed in bones and mesenchymal cells from TG mice. (C) Mesenchymal cells from transgenic mice cultured in osteogenic medium expressed lower levels of ALP activity (OD405/mg protein/30 min) compared with cells from wild-type littermates (P < 0.01). (D) Varying levels of mineralization were observed in long-term cultures of mesenchymal cells from transgenic mice (Tg-1 and Tg-2) compared with cells from wild-type (Wt) mice. Cultures were stained with Von Kossa and alizarin red.
None
Fig. 5. Sclerostin-transgenic mice are osteopenic. (A) Left panel: lumbar vertebrae (L4 and L5) from a wild-type (Wt) littermate showing normal vertebral architecture. Goldner’s trichrome stain for mineral deposition. Right panel: L4 from a wild-type littermate showing normal calcein double labeling (arrows). (B) Left panel: chondrodysplasia in L4–L6 of lumbar vertebrae from 6-week-old transgenic (Tg) mice. Vertebrae were also shorter, wider and lacked the normal trabecular and intervertebral disc architecture. Goldner stain. Right panel: fluorescence microscopy showing decreased calcein double labeling in L4 from transgenic mouse. Note the presence of hypertrophic chondrocytes, some calcified cartilage and lack of lamellar bone formation. (C) Left panel: calvarial section from a wild-type mouse showing parietal and interparietal bones. Goldner stain. Right panel: interparietal section showing normal calcein labeling. (D) Left panel: calvarial section from a transgenic mouse showing decreased bone volume. Goldner stain. Right panel: interparietal section showing markedly decreased calcein labeling.
None
Fig. 6. Bones from sclerostin-transgenic mice contained less bone and were more fragile. (A) Bone mineral content of lumbar vertebrae and proximal femur/whole femur determined by PIXIMus was significantly lower in transgenic mice (P < 0.05 and P < 0.01, respectively) compared with those from wild-type littermates. (B) Lumbar vertebrae and femurs from sclerostin-transgenic mice were significantly more fragile than those from wild-type littermates (P < 0.01 and P < 0.05, respectively). Biomechanical analyses showed that less force (N) was needed to break the bones of transgenic mice. (C) Calvariae from sclerostin-transgenic mice exhibited less bone (osteoid) volume compared with bones from wild-type littermates (P < 0.05). Values were determined from analyses of Goldner-stained bone sections. OS = osteoid surface; BS = bone surface; ObS = osteoblast surface; BV = bone volume; TV = total volume. (D) Calvariae from sclerostin-transgenic mice exhibited a lower rate of bone formation compared with those from wild-type littermates (P < 0.05). Rates were determined from analyses of calcein-labeled bones.

Similar articles

Cited by

References

    1. Abe E., Yamamoto,M., Taguchi,Y., Lecka-Czernik,B., O’Brien,C.A., Economides,A.N., Stahl,N., Jilka,R.L. and Manolagas,S.C. (2000) Essential requirement of BMPs-2/4 for both osteoblast and osteoclast formation in murine bone marrow cultures from adult mice: antagonism by noggin. J. Bone Miner. Res., 15, 663–673. - PubMed
    1. Akhter M.P., Cullen,D.M., Gong,G. and Recker,R.R. (2001) Bone biomechanical properties in prostaglandin EP1 and EP2 knockout mice. Bone, 29, 121–125. - PubMed
    1. Babcook J.S., Leslie,K.B., Olsen,O.A., Salmon,R.A. and Schrader,J.W. (1996) A novel strategy for generating monoclonal antibodies from single, isolated lymphocytes producing antibodies of defined specificities. Proc. Natl Acad. Sci. USA, 93, 7843–7848. - PMC - PubMed
    1. Balemans W. et al. (2001) Increased bone density in sclerosteosis is due to the deficiency of a novel secreted protein (SOST). Hum. Mol. Genet., 10, 537–543. - PubMed
    1. Balemans W., Foernzler,D., Parsons,C., Ebeling,M., Thompson,A., Reid,D.M., Lindpaintner,K., Ralston,S.H. and Van Hul,W. (2002) Lack of association between the SOST gene and bone mineral density in perimenopausal women: analysis of five polymorphisms. Bone, 31, 515–519. - PubMed

MeSH terms