. 2003 Dec 1;22(23):6322-34.
doi: 10.1093/emboj/cdg610.

Transcript cleavage factors GreA and GreB act as transient catalytic components of RNA polymerase

Affiliations

Transcript cleavage factors GreA and GreB act as transient catalytic components of RNA polymerase

Oleg Laptenko et al. EMBO J. .

Abstract

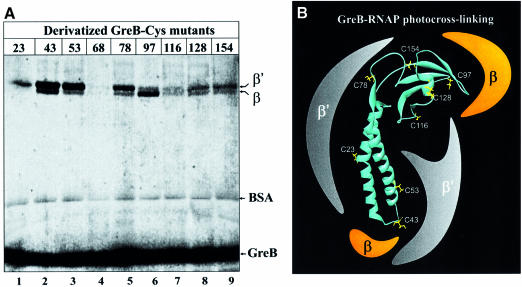
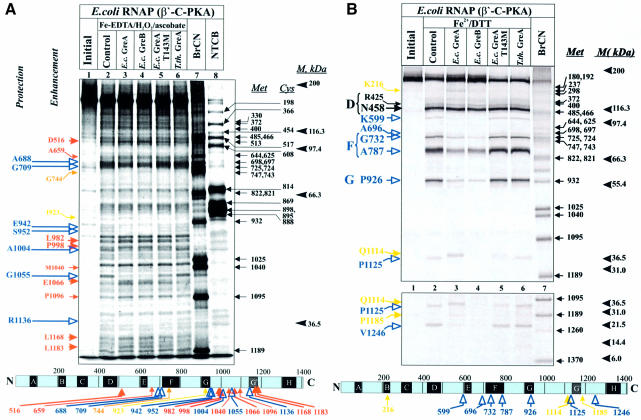
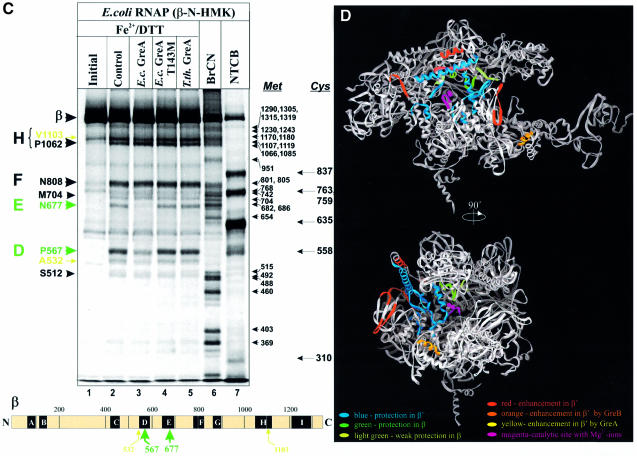
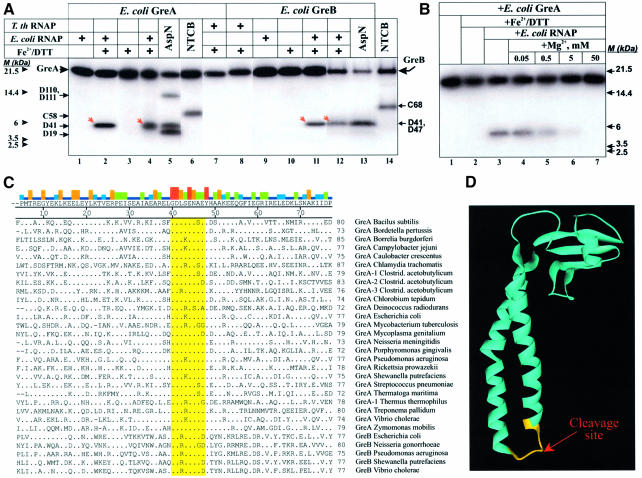
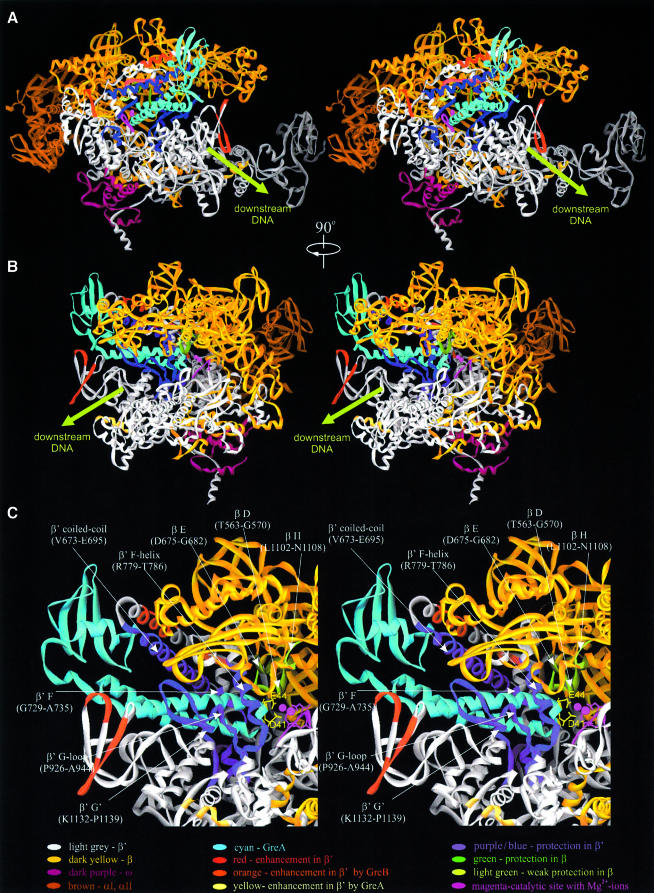
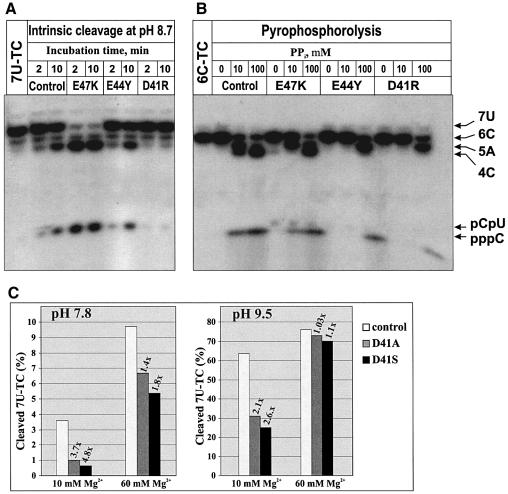
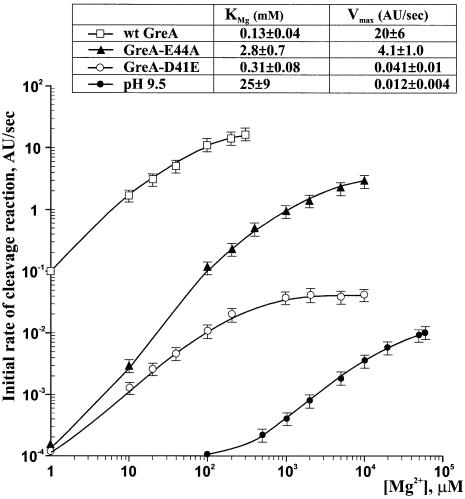
Prokaryotic transcription elongation factors GreA and GreB stimulate intrinsic nucleolytic activity of RNA polymerase (RNAP). The proposed biological role of Gre-induced RNA hydrolysis includes transcription proofreading, suppression of transcriptional pausing and arrest, and facilitation of RNAP transition from transcription initiation to transcription elongation. Using an array of biochemical and molecular genetic methods, we mapped the interaction interface between Gre and RNAP and identified the key residues in Gre responsible for induction of nucleolytic activity in RNAP. We propose a structural model in which the C-terminal globular domain of Gre binds near the opening of the RNAP secondary channel, the N-terminal coiled-coil domain (NTD) protrudes inside the RNAP channel, and the tip of the NTD is brought to the immediate vicinity of RNAP catalytic center. Two conserved acidic residues D41 and E44 located at the tip of the NTD assist RNAP by coordinating the Mg2+ ion and water molecule required for catalysis of RNA hydrolysis. If so, Gre would be the first transcription factor known to directly participate in the catalytic act of RNAP.


Figures

None
Fig. 1. Site-specific GreB–RNAP photocrosslinking. (A) Autoradiogram of 8% Tris–glycine SDS–PAGE after UV-irradiation of nine [35S]ASDPC-derivatized GreB-Cys mutants in the presence of RNAP core and BSA as a carrier protein. Numbers on top of the gel indicate the position of the Cys substitution in GreB. GreB-68 is a wt GreB used as a negative control. Positions of free β, β′, BSA and GreB are indicated by arrows. (B) Location of eight derivatized Cys on the model structure of GreB (Koulich et al., 1997), shown as ribbons and a schematic representation of their crosslinking targets.
None
Fig. 2. Hydroxyl radical footprinting and mapping of RNAP–Gre complexes. (AC) Top panels are autoradiograms of Tris–glycine SDS–7%-PAGE showing the patterns of protection/enhancement of hydroxyl radical cleavages in Gre–RNAP complexes 33P-labeled at the C-terminus of β′ (A and B) or the N-terminus of β (C). (A) General Fe–EDTA protein footprinting. (B and C) Localized hydroxyl radical mapping. Lower panel in (B) is an autoradiogram of a gradient 10–20% Bis–Tris/MES SDS–PAGE. (A, B and C) On the left of each panel, colored arrows indicate cleavage sites in β and β′ affected by Gre strongly (large arrow) or weakly (small arrow). Black arrows (B and C) indicate cleavage sites unaffected by Gre. Strong protection sites in β′ and β are shown in blue and green, respectively. Weak protection in β is shown in light green. Cleavage enhancements by GreA, GreB and both Gre are shown in yellow, orange and red, respectively. Large capital letters at left refer to conserved regions where cleavages occur. Size markers, products of chemical cleavages of β and β′ at Met and Cys, are indicated on the right by small black arrows with a number corresponding to the residue position in non-tagged β and β′. Molecular weight standards are shown on the right under the letter M. At the bottom, sites of cleavage protection and enhancement are indicated on horizontal bars representing β′ (A and B) and β (C) with conserved regions symbolized by lettered boxes. (D) Visualization of protection and enhancement sites on the 3-D structure of Tth RNAP (Vassylyev et al., 2002) with σ not shown. The backbone of RNAP subunits are shown as white ribbons with color coding indicated. Top panel is a view roughly parallel with the main axis of the RNAP secondary channel, with β on top and β′ at the bottom. The catalytic site with two Mg2+ ions (magenta) is seen through the secondary channel. Bottom panel showing the main channel view is obtained by rotation of the top view by 90° clockwise about the vertical axis.
None
Fig. 3. Localized hydroxyl radical cleavages in Gre–RNAP complexes. (A and B) Autoradiograms of gradient 10–20% Bis–Tris/MES SDS–PAGE. (A) Fe2+-mediated cleavages of GreA and GreB (red arrows) upon binding RNAP. (B) Inhibition of localized Fe2+-mediated cleavages in GreA by Mg2+. Size markers, products of chemical cleavages of Gre at Asp and Cys, are indicated by small black arrows. The proteolytic sites for AspN were established by N-terminal amino acid sequencing of all cleavage products. Molecular weight markers are shown under M (kDa). (C) Amino acid sequence alignment of GreNTD from 30 bacterial organisms (Koulich et al., 2000 and references within; Hogan et al., 2002). Consensus sequence is shown above the alignment. Numbering is according to E.coli GreA. The colored bars on top indicate sequence conservation: red, 100% identity; dark blue, <20%; orange, green, and light blue represent intermediate levels. The conserved tip is highlighted. (D) Location of the cleavage site (in yellow) on the 3-D structure of GreA (Stebbins et al., 1995), shown as ribbons.
None
Fig. 4. 3-D structural model of Gre–RNAP complex. (AC) Three views of the complex shown in ribbon diagram with color coding indicated. Views A and B are the same as two views in Figure 2D. (C) The blown up view of B with proposed regions of Gre–RNAP interactions indicated. The side chains of two essential residues of GreANTD tip, D41 and E44, are shown in yellow.
None
Fig 5. Inhibitory effects of GreA-D41 and -E44 mutations. Autoradiograms show (A) a time course of 7U-TC cleavage into pentamer (5A) and dimer (pCpU) at pH 8.7 with and without Gre mutants, and (B) pyrophorolysis of 6C-TC into 5A, tetramer (4C) and CTP at pH 7.5 with and without Gre mutants at different concentrations of pyrophosphate. 6C- and 7U-TC carry transcripts internally radiolabeled at C. (C) Effect of Mg2+ on the inhibition of intrinsic transcript cleavage activity by GreA-D41A and -D41S mutants. Bar graphs show the decrease in the amount of the 7U-TC after 10 min incubation at 30°C under indicated conditions. The % of 7U-TC cleaved was calculated based on the amount of 5A formed in the course of the reaction. Numbers on top of the bars indicate fold inhibition by D41A (gray) and D41S (black) compared to control (white).
None
Fig. 6. Dependence of the rate of endonucleolytic reaction on Mg2+ concentration. The curves in the graph show the initial rates of 5A formation from 7U-TC at 2°C as a function of Mg2+ concentration at pH 9.5 or at pH 7.5 in the presence of different GreA mutants. Horizontal bars above and below each data point indicate experimental errors. The apparent dissociation constant for Mg2+ ion (KMg) and maximum rate of nucleolytic reaction (Vmax) were derived from double reciprocal plots (see Supplementary figure 6) of the data shown in the graph.

Similar articles

Cited by

References

    1. Borukhov S. and Goldfarb,A. (1993) Recombinant Escherichia coli RNA polymerase: purification of individually overexpressed subunits and in vitro assembly. Protein Expr. Purif., 4, 503–511. - PubMed
    1. Borukhov S. and Goldfarb,A. (1996) Purification and assay of Escherichia coli transcript cleavage factors GreA and GreB. Methods Enzymol., 274, 315–326. - PubMed
    1. Borukhov S., Sagitov,V. and Goldfarb,A. (1993) Transcript cleavage factors from E.coli. Cell, 72, 459–466. - PubMed
    1. Borukhov S., Laptenko,O. and Lee,J. (2001) Escherichia coli transcript cleavage factors GreA and GreB: functions and mechanisms of action. Methods Enzymol., 342, 64–76. - PubMed
    1. Chen Y., Ebright,Y.W. and Ebright,R.H. (1994) Identification of the target of a transcription activator protein by protein–protein photocrosslinking. Science, 265, 90–92. - PubMed

Publication types

MeSH terms