. 2003 Dec 1;22(23):6335-45.
doi: 10.1093/emboj/cdg604.

Methyl-CpG binding proteins identify novel sites of epigenetic inactivation in human cancer

Affiliations

Methyl-CpG binding proteins identify novel sites of epigenetic inactivation in human cancer

Esteban Ballestar et al. EMBO J. .

Abstract

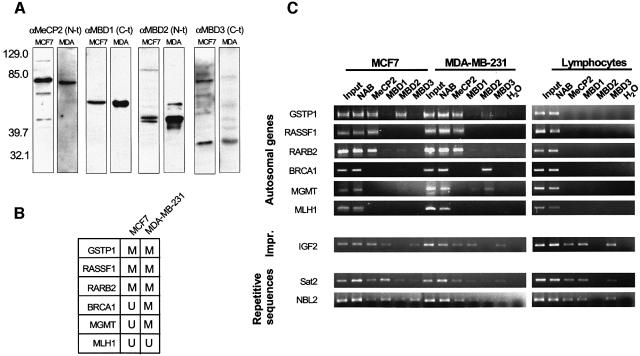
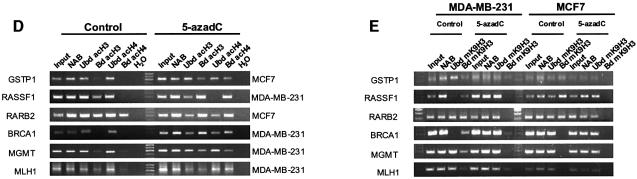
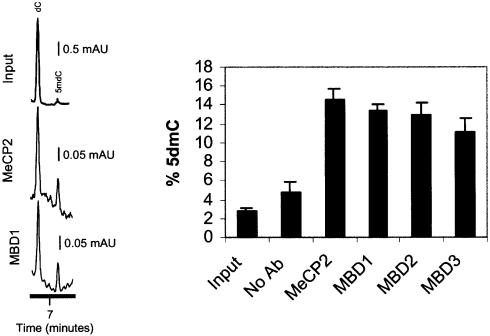
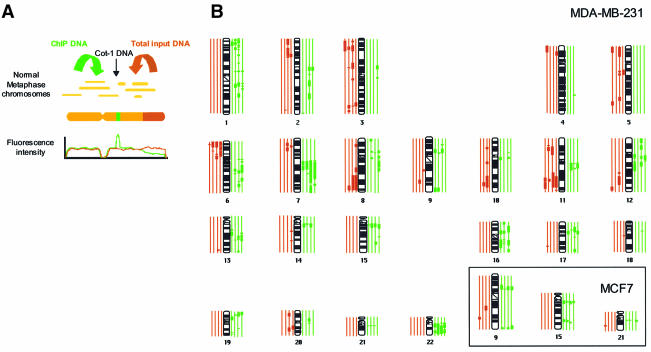
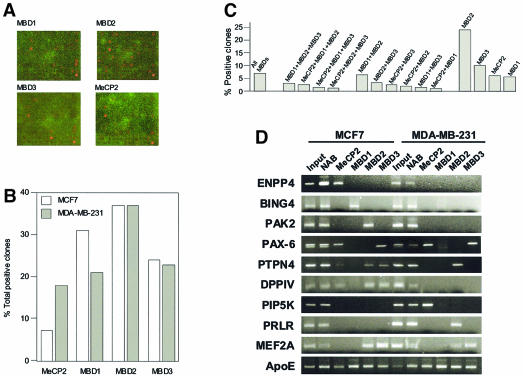
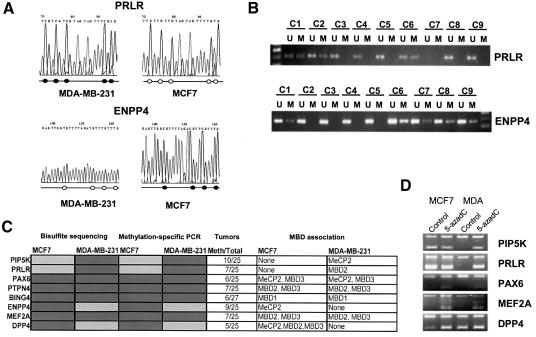
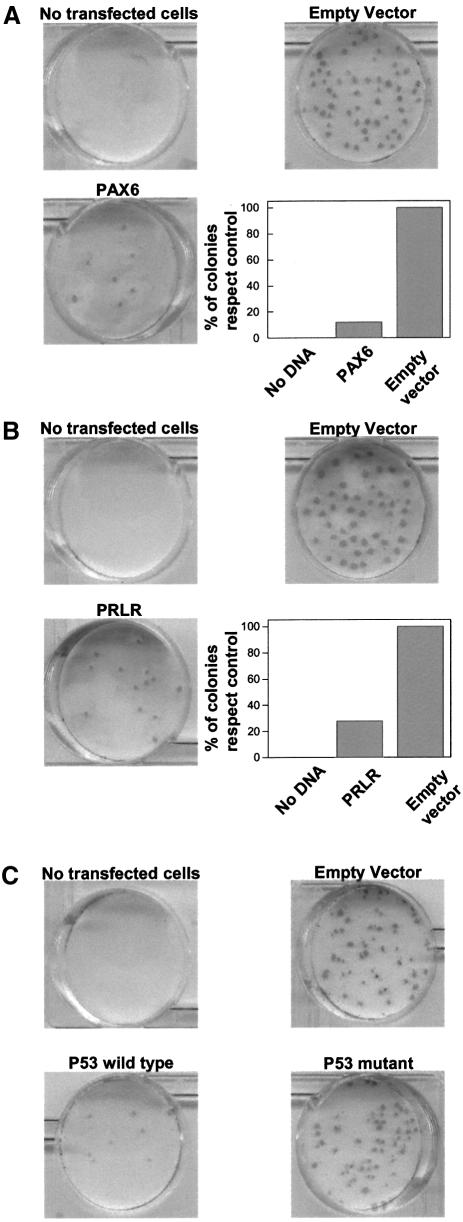
Methyl-CpG binding proteins (MBDs) mediate histone deacetylase-dependent transcriptional silencing at methylated CpG islands. Using chromatin immunoprecitation (ChIP) we have found that gene-specific profiles of MBDs exist for hypermethylated promoters of breast cancer cells, whilst a common pattern of histone modifications is shared. This unique distribution of MBDs is also characterized in chromosomes by comparative genomic hybridization of immunoprecipitated DNA and immunolocalization. Most importantly, we demonstrate that MBD association to methylated DNA serves to identify novel targets of epigenetic inactivation in human cancer. We combined the ChIP assay of MBDs with a CpG island microarray (ChIP on chip). The scenario revealed shows that, while many genes are regulated by multiple MBDs, others are associated with a single MBD. These target genes displayed methylation- associated transcriptional silencing in breast cancer cells and primary tumours. The candidates include the homeobox gene PAX6, the prolactin hormone receptor, and dipeptidylpeptidase IV among others. Our results support an essential role for MBDs in gene silencing and, when combined with genomic strategies, their potential to 'catch' new hypermethylated genes in cancer.


Figures

None
Fig. 1. ChIP analysis of the occupancy by MBD proteins and histone modification status of several hypermethylated promoters. (A) MBD antisera αMeCP2 N-t, αMBD1 C-t, αMBD2 N-t, αMBD3 C-t were tested on MCF7 and MDA-MB-231 nuclear extracts. On the left, molecular size bands of a pre-stained standard (Kaleidoscope, BioRad) are indicated. Comparable results were obtained with MDA-MB-231 nuclear extracts. (B) A summary of the methylation status of the studied promoters in MCF7 and MDA-MB-231 (extracted from Esteller, 2002). (C) MBD occupancy analysed by ChIP assay. Input and ‘unbound’ fraction of the no antibody (NAB) control are shown followed by the four ‘bound’ fractions for each antibody. ChIP assays shown correspond to MCF7 and MDA-MB-231 cells and isolated lymphocytes. Results with lymphoblastoid cell lines are undistinguishable from those obtained with control lymphocytes. Three groups of sequences are shown: CpG islands tumour suppressor genes, an imprinted gene (IGF2) and repetitive sequences (Sat2 and NBL2). (D) Analysis of the acetylation status of each promoter. Commercial anti-acetylH3 and anti-acetylH4 were used (Upstate Biotechnologies). Control cells and 5-azadC treated cells are shown. (E) Analysis of the methylation status of K9 of H3 is studied. An H3 antibody to a branched peptide with four fingers of the K9-dimethylated TARKST sequence (Lachner et al., 2001) was used.
None
Fig. 2. Analysis of global DNA methylation by HPCE of MBD-immunoprecipitated samples. Two electropherograms, corresponding to the input fraction, the MBD1 and MBD2 immunoprecipitated DNAs from MCF7 cells, are shown. The graph shows the methylcytosine content in the same fractions.
None
Fig. 3. Comparative genomic hybridization of MBD-immunoprecipitated DNAs in metaphase chromosomes. (A) Diagram showing the combination of comparative genome hybridization with the ChIP assay. (B) Ideograms showing hybridization of ChIP DNAs on the human karyotype. Thick vertical lines on either side of the chromosome ideogram indicate only recurrent MBD enrichment (green) or exclusion (red) of a chromosome or a chromosomal region. The four green and four red lines correspond, respectively, to MBD1, MBD2, MBD3 and MeCP2 from inside to outside. The analysis shown corresponds to MDA-MB-231 samples. The inset shows three chromosomes from the MCF7 samples.
None
Fig. 4. (A) Representative microarray images for different MBD-immunoprecipitated MDA-MB-231 samples. Cy5 labelled chromatin DNAs were hybridized to CpG island microarray as described in the text. The hybridization images were acquired and normalized signal intensities of hybridized spots were compared to those of the control (total input). (B) Graph showing the percentage of total positive clones (relative to the total input control) obtained for each MBD-immunoprecipitated DNA. (C) Graph showing the percentage of positive clones for the different combinations: all MBD proteins, three MBDs, two MBDs or a single MBD. (D) Confirmation of MBD targets by individual ChIP analysis and PCR with primers designed to the individual loci. Input, no antibody (unbound fraction) and MBD immunoprecipitated fractions (bound) are shown.
None
Fig. 5. DNA methylation and expression analysis of the particular genes found using the ChIP on chip approach. (A) Bisulfite genomic sequencing of the PRLR CpG island demonstrating hypermethylation in MDA-MB-231 cells and hypomethylation in MCF7 cells. On the contrary, the ENPP4 CpG island is hypermethylated in MCF7 cells but not in MDA-MB-231 cells. A fragment of the sequence is shown. Unmethylated Cs become Ts upon bisulfite modification. Below, a schematic representation of some of the CpG sites included in the PCR fragment is shown. CpG sites are represented as circles that are black when methylated. (B) Methylation-specific PCR confirms the presence of hypermethylation in ENPP4 and PRLR primary breast tumours. A number of cases are shown, indicated as c1–c9. (C) Summary table with the bisulfite sequence, methylation-specific PCR results for MCF7, MDA-MB-231 and primary breast tumours. Dark and light shading indicates methylation or no methylation, respectively. (D) Expression analysis monitored by RT–PCR after co-amplification with GAPDH. In all panels, the top band (400 bp) is GAPDH and the bottom band (of ∼200 bp) is each of the specific genes.
None
Fig. 6. The effect of exogenous expression of PAX6 and PRLR on the colony formation of MDA-MB-231 cells. PAX6 and PRLR methylation-silenced cells (i.e. MDA-MB-231) were transfected with a PAX6 (A) and PRLR (B) expression vector or the empty vector as indicated in Materials and methods. Relative number of resistant colonies after transfection, calculated as the percentage of colonies with respect to the untransfected cells, are shown in the inset. (C) Effect of the exogenous expression of wild-type and mutant p53.

References

    1. Bakker J., Lin,X. and Nelson,W.G. (2002) Methyl-CpG binding domain protein 2 represses transcription from hypermethylated pi-class glutathione S-transferase gene promoters in hepatocellular carcinoma cells. J. Biol. Chem., 277, 22573–22580. - PubMed
    1. Ballestar E. and Wolffe,A.P. (2001) Methyl-CpG-binding proteins. Targeting specific gene repression. Eur. J. Biochem., 268, 1–6. - PubMed
    1. Bird A.P. and Wolffe,A.P. (1999) Methylation-induced repression: belts, braces and chromatin. Cell, 99, 451–454. - PubMed
    1. Cedar H. (1988) DNA methylation and gene activity. Cell, 53, 3–4. - PubMed
    1. Chatah N.E. and Abrams,C.S. (2001) G-protein-coupled receptor activation induces the membrane translocation and activation of phosphatidylinositol-4-phosphate 5-kinase I α by a Rac- and Rho-dependent pathway. J. Biol. Chem., 276, 34059–34065. - PubMed

Publication types

MeSH terms