

Pharmacodynamics of the new des-f(6)-quinolone garenoxacin in a murine thigh infection model
- PMID: 14638504
- PMCID: PMC296207
- DOI: 10.1128/AAC.47.12.3935-3941.2003
Pharmacodynamics of the new des-f(6)-quinolone garenoxacin in a murine thigh infection model
Abstract
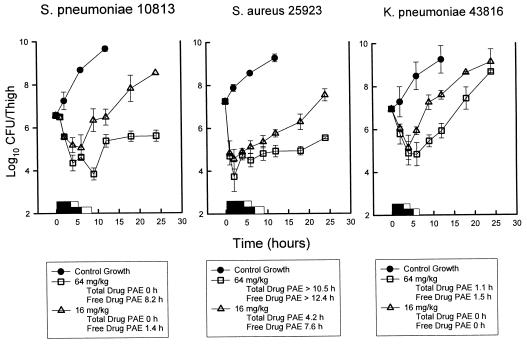
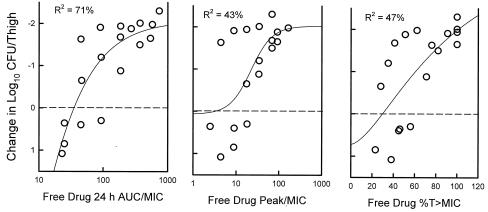
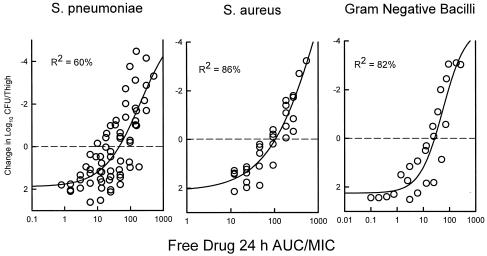
Garenoxacin is a new des-F(6)-quinolone with broad-spectrum activity against both gram-positive cocci and gram-negative bacilli. We used the neutropenic murine thigh infection model to characterize the time course of antimicrobial activity of garenoxacin and determine which pharmacokinetic-pharmacodynamic (PK-PD) parameter best correlated with efficacy. Serum drug levels following three fourfold-escalating single-dose levels of garenoxacin were measured by microbiologic assay. In vivo postantibiotic effects (PAEs) were determined after doses of 16 and 64 mg/kg of body weight. Mice had 10(6.5) to 10(6.7) CFU of Streptococcus pneumoniae strain ATCC 10813 or Staphylococcus aureus strain ATCC 33591 per thigh when they were treated for 24 h with garenoxacin at a dose of 4 to 128 mg/kg/day fractionated for 3-, 6-, 12-, and 24-hour dosing regimens. Nonlinear regression analysis was used to determine which PK-PD parameter best correlated with the measurement of CFU/thigh at 24 h. Pharmacokinetic studies yielded peak/dose values of 0.2 to 0.3, area under the concentration-time curve (AUC)/dose values of 0.1 to 0.5, and half-lives of 0.7 to 1.6 h. Garenoxacin produced in vivo PAEs of 1.4 to 8.2 h with S. pneumoniae ATCC 10813, 7.6 to >12.4 h with S. aureus ATCC 25923, and 0 to 1.5 h with Klebsiella pneumoniae ATCC 43816. The 24-h AUC/MIC ratio was the PK-PD parameter that best correlated with efficacy (R2=71 to 90% for the two organisms compared with 43 to 56% for the peak/MIC ratio and 47 to 75% for percent time above the MIC [% T>MIC]). In subsequent studies we used the neutropenic murine thigh infection model to determine if the magnitude of the AUC/MIC ratio needed for efficacy of garenoxacin varied among pathogens (including resistant strains). Mice had 10(5.9) to 10(7.2) CFU of 6 strains of S. aureus (2 methicillin resistant), 11 strains of S. pneumoniae (5 penicillin susceptible, 1 penicillin intermediate, and 5 penicillin resistant, and of the resistant strains, 3 were also ciprofloxacin resistant), and 4 gram-negative strains per thigh when treated for 24 h with 1 to 64 mg of garenoxacin per kg every 12 h. A sigmoid dose-response model was used to estimate the doses (mg/kg/24 h) required to achieve a net bacteriostatic effect over 24 h. MICs ranged from 0.008 to 4 microg/ml. The free drug 24-h AUC/MIC ratios for each static dose (2.8 to 128 mg/kg/day) varied from 8.2 to 145. The mean 24-h AUC/MIC ratios +/- standard deviations for S. pneumoniae, S. aureus, and gram-negative strains were 33 +/- 18, 81 +/- 37, and 33 +/- 30, respectively. Methicillin, penicillin, or ciprofloxacin resistance did not alter the magnitude of the AUC/MIC ratio required for efficacy.
Figures


Similar articles
-
Pharmacodynamics of the new fluoroquinolone gatifloxacin in murine thigh and lung infection models.Antimicrob Agents Chemother. 2002 Jun;46(6):1665-70. doi: 10.1128/AAC.46.6.1665-1670.2002. Antimicrob Agents Chemother. 2002. PMID: 12019073 Free PMC article.
-
Pharmacodynamics of a new streptogramin, XRP 2868, in murine thigh and lung infection models.Antimicrob Agents Chemother. 2006 Jan;50(1):243-9. doi: 10.1128/AAC.50.1.243-249.2006. Antimicrob Agents Chemother. 2006. PMID: 16377693 Free PMC article.
-
Pharmacodynamics of a new cephalosporin, PPI-0903 (TAK-599), active against methicillin-resistant Staphylococcus aureus in murine thigh and lung infection models: identification of an in vivo pharmacokinetic-pharmacodynamic target.Antimicrob Agents Chemother. 2006 Apr;50(4):1376-83. doi: 10.1128/AAC.50.4.1376-1383.2006. Antimicrob Agents Chemother. 2006. PMID: 16569855 Free PMC article.
-
Pharmacodynamics to combat resistance.J Antimicrob Chemother. 2000 Jul;46 Suppl T1:25-31. doi: 10.1093/oxfordjournals.jac.a020890. J Antimicrob Chemother. 2000. PMID: 10997596 Review.
-
How can we predict bacterial eradication?Int J Infect Dis. 2003 Mar;7 Suppl 1:S13-20. doi: 10.1016/s1201-9712(03)90066-x. Int J Infect Dis. 2003. PMID: 12839703 Review.
Cited by
-
In Vivo Pharmacodynamic Target Investigation of Two Bacterial Topoisomerase Inhibitors, ACT-387042 and ACT-292706, in the Neutropenic Murine Thigh Model against Streptococcus pneumoniae and Staphylococcus aureus.Antimicrob Agents Chemother. 2016 May 23;60(6):3626-32. doi: 10.1128/AAC.00363-16. Print 2016 Jun. Antimicrob Agents Chemother. 2016. PMID: 27044547 Free PMC article.
-
In Vivo Bioluminescent Monitoring of Therapeutic Efficacy and Pharmacodynamic Target Assessment of Antofloxacin against Escherichia coli in a Neutropenic Murine Thigh Infection Model.Antimicrob Agents Chemother. 2017 Dec 21;62(1):e01281-17. doi: 10.1128/AAC.01281-17. Print 2018 Jan. Antimicrob Agents Chemother. 2017. PMID: 29038275 Free PMC article.
-
In Vivo Pharmacodynamic Target Determination for Delafloxacin against Klebsiella pneumoniae and Pseudomonas aeruginosa in the Neutropenic Murine Pneumonia Model.Antimicrob Agents Chemother. 2019 Sep 23;63(10):e01131-19. doi: 10.1128/AAC.01131-19. Print 2019 Oct. Antimicrob Agents Chemother. 2019. PMID: 31332063 Free PMC article.
-
Optimal dose finding of garenoxacin based on population pharmacokinetics/pharmacodynamics and Monte Carlo simulation.Eur J Clin Pharmacol. 2012 Jan;68(1):39-53. doi: 10.1007/s00228-011-1095-3. Epub 2011 Jul 28. Eur J Clin Pharmacol. 2012. PMID: 21796376 Free PMC article. Clinical Trial.
-
In Vivo Pharmacodynamic Target Assessment of Delafloxacin against Staphylococcus aureus, Streptococcus pneumoniae, and Klebsiella pneumoniae in a Murine Lung Infection Model.Antimicrob Agents Chemother. 2016 Jul 22;60(8):4764-9. doi: 10.1128/AAC.00647-16. Print 2016 Aug. Antimicrob Agents Chemother. 2016. PMID: 27216072 Free PMC article.
References
-
- Andes, D. R., and W. A. Craig. 1998. Pharmacodynamics of fluoroquinolones in experimental models of endocarditis. Clin. Infect. Dis. 27:47-50. - PubMed
-
- Blaser, J., B. B. Stone, M. C. Groner, and S. H. Zinner. 1987. Comparative study with enoxacin and netilmicin in a pharmacodynamic model to determine importance of ratio of antibiotic peak concentration to MIC for bacterial activity and emergence of resistance. Antimicrob. Agents Chemother. 31:1054-1060. - PMC - PubMed
-
- Craig, W., and A. Dalhoff. 1998. Pharmacodynamics of fluoroquinolones in experimental animals, p. 208-232. In J. Kuhlman, A. Dalhoff, and H. J. Zeiller (ed.), Handbook of experimental pharmacology, vol. 127. Quinolone antibacterials. Springer-Verlag, Berlin, Germany.
MeSH terms
Substances
LinkOut - more resources
Full Text Sources
Medical
Molecular Biology Databases
