. 2003 Dec 1;198(11):1643-52.
doi: 10.1084/jem.20021784. Epub 2003 Nov 24.

Lymphotoxin is required for maintaining physiological levels of serum IgE that minimizes Th1-mediated airway inflammation

Affiliations

Lymphotoxin is required for maintaining physiological levels of serum IgE that minimizes Th1-mediated airway inflammation

Hyung-Sik Kang et al. J Exp Med. .

Abstract

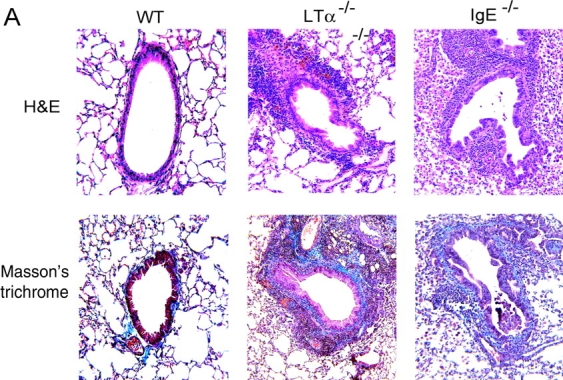
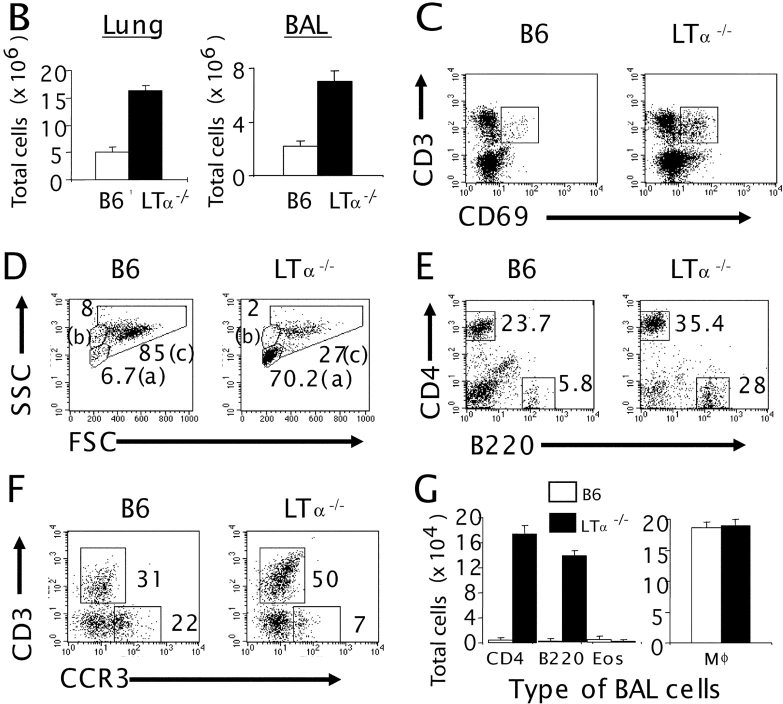
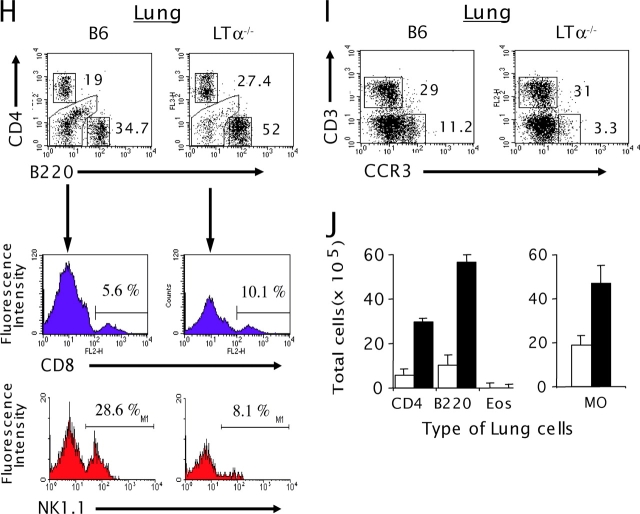
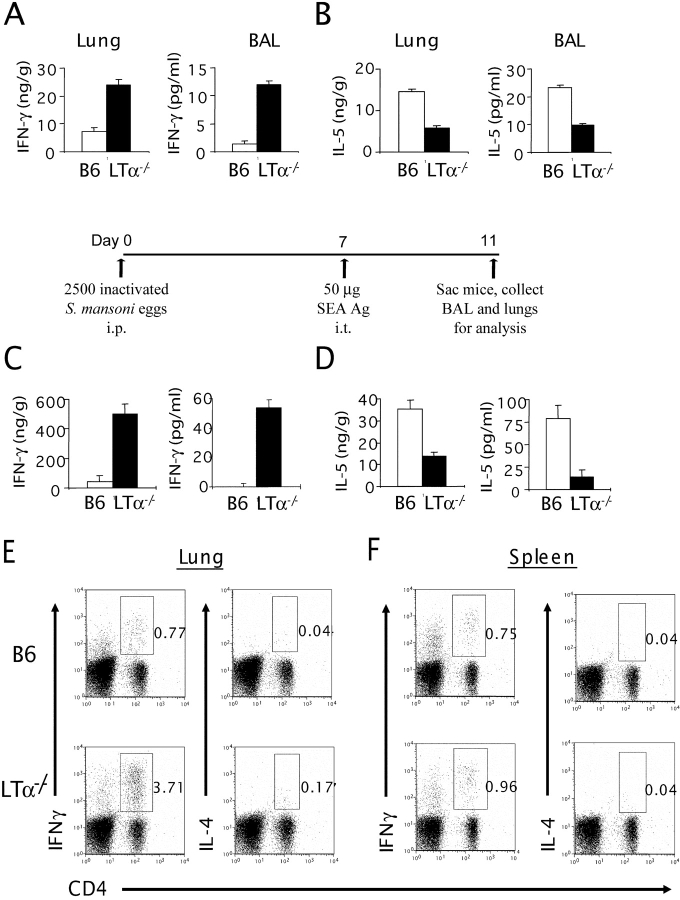
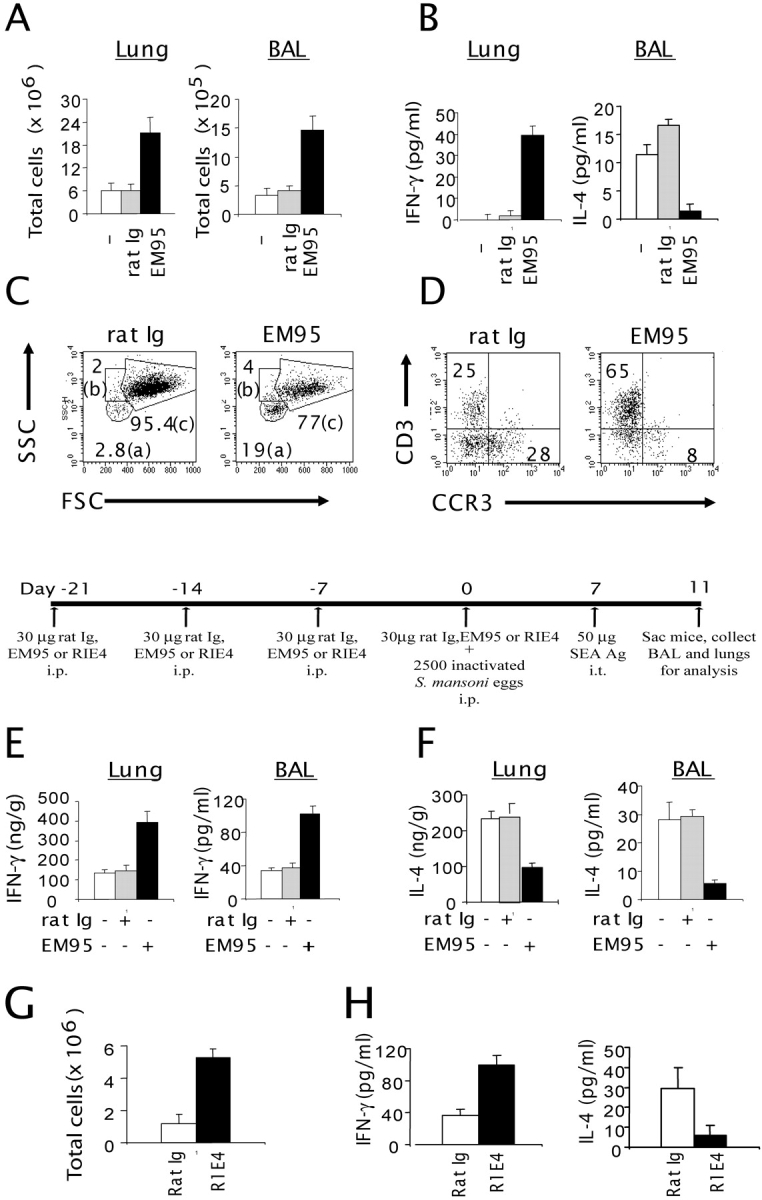
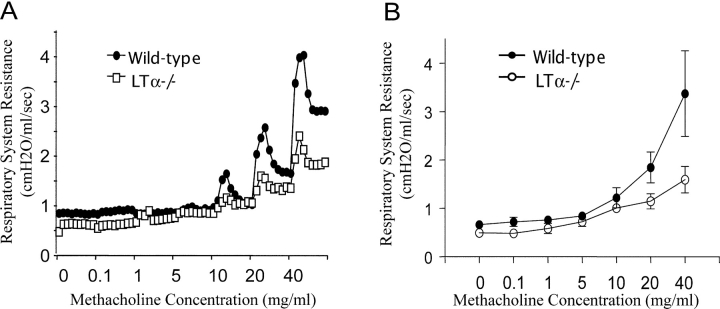
Although elevated levels of IgE in asthmatic patients are strongly associated with lung infiltration by activated T helper (Th) 2 cells, the physiological role of immunoglobulin E (IgE) in the airway remains largely undefined. Lymphotoxin-deficient alpha (LTalpha-/-) mice exhibit increased airway inflammation, paradoxically accompanied by diminished levels of IgE and reduced airway hyperresponsiveness in response to both environmental and induced antigen challenge. The severe lung inflammation in LTalpha-/- mice is Th1 in nature and can be alleviated by IgE reconstitution. Conversely, depletion of IgE in wild-type mice recapitulates the lung pathologies of LTalpha-/- mice. Therefore, this work has revealed that lymphotoxin is essential for IgE production, and a physiological role of IgE in the airway may consist of maintaining the balance of Th1 and Th2 responses to prevent aberrant inflammation.


Figures

Figure 1.
Figure 1.
Increased inflammation and airway remodeling in LTα−/− and IgE−/− mice. (A) Lung tissues from WT, LTα−/−, and IgE−/− mice (3 mo old) were fixed in 10% buffered formalin and embedded in paraffin. Hematoxylin and eosin staining (top, H&E) and Masson's trichrome staining (bottom) of B6, LTα−/−, and IgE−/− mice are presented. (B) The lung (left) and BAL cells (right) were isolated by collagenase digestion and lavage, respectively, from 3-mo-old B6 (white bars) and LTα−/− (black bars) mice (n = 5 per group). The total number of cells was analyzed with trypan blue staining. The number of leukocytes in the lung of LTα−/− mice is significantly higher than that of the WT (P < 0.001). BAL cells from five mice were pooled for further analysis by FACS®. (C) Lung cells were dually stained with FITC-conjugated anti-CD69 and PE-conjugated anti-CD3. The fluorescence intensity was analyzed from the gated lymphocyte population of B6 (left) and LTα−/− (right) mice. The percentage of CD69+ cells among CD3+ cells is presented. (D) The forward/side scatter dot-plot profiles were analyzed from BAL cells of B6 (left) and LTα−/− (right) mice; (a), (b), and (c) represent the lymphocyte, granulocyte, and macrophage population, respectively. (E) The gated lymphocyte population (a) from the forward/side scatter dot-plot profiles of BAL cells (D) was analyzed for CD4 and B220 expression by FACS® analysis. (F) CCR3 and CD3 expression was analyzed from both the gated lymphocyte (a) and granulocyte (b) populations. (G) The type of BAL cells was determined by calculating the absolute number of each cell type from the FACS® profiles and by the total number of cells (P < 0.0001; WT vs. LTα−/−). (H) B6 and LTα−/− mice were analyzed by three-color staining with FITC–anti-B220, cychrome–anti-CD4, and PE–anti-CD8 or PE–anti-NK1.1. The gated lymphocyte population (a) from the forward/side scatter dot-plot profiles of the lung cells was analyzed for CD4 and B220 (P < 0.01, WT vs. LTα−/− mice). The percentage of CD8+ or NK1.1+ cells gated from B220CD4 was evaluated. (I) CCR3 and CD3 expression was analyzed from both the gated lymphocyte (a) and granulocyte (b) population. (J) The total number of cells was calculated. The type of lung cells was also determined by calculating the absolute number of each cell type from the FACS® profiles. The results are representative of five independent experiments.
Figure 1.
Figure 1.
Increased inflammation and airway remodeling in LTα−/− and IgE−/− mice. (A) Lung tissues from WT, LTα−/−, and IgE−/− mice (3 mo old) were fixed in 10% buffered formalin and embedded in paraffin. Hematoxylin and eosin staining (top, H&E) and Masson's trichrome staining (bottom) of B6, LTα−/−, and IgE−/− mice are presented. (B) The lung (left) and BAL cells (right) were isolated by collagenase digestion and lavage, respectively, from 3-mo-old B6 (white bars) and LTα−/− (black bars) mice (n = 5 per group). The total number of cells was analyzed with trypan blue staining. The number of leukocytes in the lung of LTα−/− mice is significantly higher than that of the WT (P < 0.001). BAL cells from five mice were pooled for further analysis by FACS®. (C) Lung cells were dually stained with FITC-conjugated anti-CD69 and PE-conjugated anti-CD3. The fluorescence intensity was analyzed from the gated lymphocyte population of B6 (left) and LTα−/− (right) mice. The percentage of CD69+ cells among CD3+ cells is presented. (D) The forward/side scatter dot-plot profiles were analyzed from BAL cells of B6 (left) and LTα−/− (right) mice; (a), (b), and (c) represent the lymphocyte, granulocyte, and macrophage population, respectively. (E) The gated lymphocyte population (a) from the forward/side scatter dot-plot profiles of BAL cells (D) was analyzed for CD4 and B220 expression by FACS® analysis. (F) CCR3 and CD3 expression was analyzed from both the gated lymphocyte (a) and granulocyte (b) populations. (G) The type of BAL cells was determined by calculating the absolute number of each cell type from the FACS® profiles and by the total number of cells (P < 0.0001; WT vs. LTα−/−). (H) B6 and LTα−/− mice were analyzed by three-color staining with FITC–anti-B220, cychrome–anti-CD4, and PE–anti-CD8 or PE–anti-NK1.1. The gated lymphocyte population (a) from the forward/side scatter dot-plot profiles of the lung cells was analyzed for CD4 and B220 (P < 0.01, WT vs. LTα−/− mice). The percentage of CD8+ or NK1.1+ cells gated from B220CD4 was evaluated. (I) CCR3 and CD3 expression was analyzed from both the gated lymphocyte (a) and granulocyte (b) population. (J) The total number of cells was calculated. The type of lung cells was also determined by calculating the absolute number of each cell type from the FACS® profiles. The results are representative of five independent experiments.
Figure 2.
Figure 2.
LT is required for IgE production. The sera from various 12–16-wk-old LTα−/− mice (n = 9) were collected, and total IgE concentration was measured by ELISA. Data represent the mean ± SE.
Figure 3.
Figure 3.
LTα−/− airways display a Th1 phenotype even after a strong Th2 antigen challenge. The lung tissues from B6 and LTα−/− mice (n = 3–5 per group) were homogenized in PBS containing proteinase inhibitors, and the supernatants were collected by centrifugation. Cytokines from the BAL were measured after a 1-ml flushing of the airways through the trachea. IFN-γ (A) and IL-5 (B) levels were measured by ELISA from the lung lysates (left) and BAL fluids (right). (C and D) B6 and LTα−/− mice were sensitized i.p. on day 0 with 5 × 10³ inactivated soluble S. mansoni egg antigen (SEA). On day 7, the mice were challenged i.t. with SEA. On day 11, mice were killed, and cytokines from the lung and BAL were analyzed. The lung lysates and BAL fluids of those mice were subjected to ELISA. IFN-γ (C) and IL-5 (D) levels are shown (P < 0.05). Data represent the mean ± SD from a representative experiment. Experiments were repeated four times by different individuals with similar results. For intracellular staining, lung cells (E) and splenocytes (F) were collected and stimulated as described in Materials and Methods. Extracellular staining was performed using anti–CD4-PE, and intracellular staining was performed using either IL-4–allophycocyanin or IFNγ-allophycocyanin.
Figure 4.
Figure 4.
IgE reconstitution of LTα−/− mice results in the reduction of the total cell number and a shift from a Th1 to Th2 cytokine profile in the lung and BAL cells. (A) LTα−/− mice (n = 3) were treated i.p. with 500 ng of mouse Ig or purified IgE once per week for 3 wk. 1 wk after the last treatment, the total number of cells in the lung and BAL of B6, mIg-, or IgE-treated LTα−/− mice were analyzed by trypan blue staining. IgE-reconstituted LTα−/− mice have similar total cell numbers compared with control mice (P < 0.01). (B) Reconstituted LTα−/− have reduced leukocytes in the BAL and lung compared with control treated mice (P < 0.01). The cell number was determined by calculating the total number of cells and the absolute number of each cell type from the FACS® profile. IFN-γ and IL-5 levels were determined by ELISA from BAL fluids of mIg- or purified IgE-treated LTα−/− mice. (P < 0.05; IgE vs. mIg). (C) LTα−/− mice (n = 3) were injected i.p. with either 500 ng mouse Ig or purified IgE on day −21, −14, and −7. On day 0, mice were injected with either mIg or IgE and sensitized i.p. with 2.5 × 10³ inactivated S. mansoni eggs. On day 7, the mice were challenged i.t. with 50 μg SEA. On day 11, mice were killed and analyzed for the total number of cells in BAL and digested lung (P < 0.01; IgE vs. mIg). (D) The type of cells present in the BAL of SEA-challenged and mIg- or IgE-reconstituted LTα−/− mice was determined by calculating the total number of cells and the absolute number of each cell type from the FACS® profiles. IFN-γ and IL-5 levels were measured from BAL fluids of SEA-challenged and mIg- or IgE-reconstituted LTα−/− mice (P < 0.001 for IFN-γ; P < 0.05 for IL-5; IgE vs. mIg). Data represent the mean ± SD from a representative experiment. Experiments were repeated four times by different individuals with similar results.
Figure 5.
Figure 5.
Increased cell number and altered cytokine production in the lung and BAL cells of IgE-depleted WT mice. (A) B6 mice (n = 3) were treated i.p. with 50 μg of rat Ig or anti-IgE (EM95) once per week for 3 wk. 1 wk after the last treatment, the total number of cells in the lung and BAL was analyzed (P < 0.01; EM95 vs. control group). (B) IFN-γ and IL-4 levels were determined by ELISA in BAL fluids from B6 mice treated with either rat Ig or anti-IgE (P < 0.05; EM95 vs. control group). (C) The forward/side scatter dot-plot profiles were analyzed from B6 mice treated with either rat Ig (left) or EM95 (right). (D) The CCR3 and CD3 expression was analyzed from both the gated lymphocyte (a) and granulocyte population (b). (E) B6 mice were injected i.p. on day −21, −14, and −7 with 30 μg rat Ig or EM95. On day 0, the mice were injected i.p. with 30 μg rat Ig or anti-IgE sensitized i.p. with 2.5 × 10³ inactivated S. mansoni eggs. On day 7, the mice were challenged i.t. with SEA. On day 11, mice were killed and analyzed. IFN-γ (E) and IL-4 levels (F) were measured from the lung lysates (left) and BAL fluids (right) by ELISA. Similar experiments were performed using a noncross-linking anti-IgE antibody, R1E4 (G and H). The number of BAL cells (G) and cytokine profiles (H) were determined as described in A and B (P < 0.01; R1E4 vs. control group). Data represent the mean ± SD from a representative experiment. Experiments were repeated four times by different individuals with similar results.
Figure 6.
Figure 6.
Methacholine dose–response curves for respiratory system resistance in a WT mouse versus an LTα−/− mouse. Invasive measurement was used to determine respiratory system resistance in anesthetized, tracheostomized, mechanically ventilated mice. (A) Dose-dependent bronchoconstriction was induced by i.v. methacholine administration to WT mice versus LTα−/− mice. (B) The peak resistance from each dose from pooled data from three experiments was analyzed to compare both groups (n = 4; P < 0.005).

References

    1. Yazdanbakhsh, M., P.G. Kremsner, and R. van Ree. 2002. Allergy, parasites, and the hygiene hypothesis. Science. 296:490–494. - PubMed
    1. Robinson, D.S., Q. Hamid, S. Ying, A. Tsicopoulos, J. Barkans, A.M. Bentley, C. Corrigan, S.R. Durham, and A.B. Kay. 1992. Predominant TH2-like bronchoalveolar T-lymphocyte population in atopic asthma. N. Engl. J. Med. 326:298–304. - PubMed
    1. Maddox, L., and D.A. Schwartz. 2002. The pathophysiology of asthma. Annu. Rev. Med. 53:477–498. - PubMed
    1. Lewis, D.B. 2002. Allergy immunotherapy and inhibition of Th2 immune responses: a sufficient strategy? Curr. Opin. Immunol. 14:644–651. - PubMed
    1. Burrows, B., F.D. Martinez, M. Halonen, R.A. Barbee, and M.G. Cline. 1989. Association of asthma with serum IgE levels and skin-test reactivity to allergens. N. Engl. J. Med. 320:271–277. - PubMed

Publication types