. 2003 Nov 24;163(4):871-8.
doi: 10.1083/jcb.200304132.

Nucleolin expressed at the cell surface is a marker of endothelial cells in angiogenic blood vessels

Affiliations

Nucleolin expressed at the cell surface is a marker of endothelial cells in angiogenic blood vessels

Sven Christian et al. J Cell Biol. .

Abstract

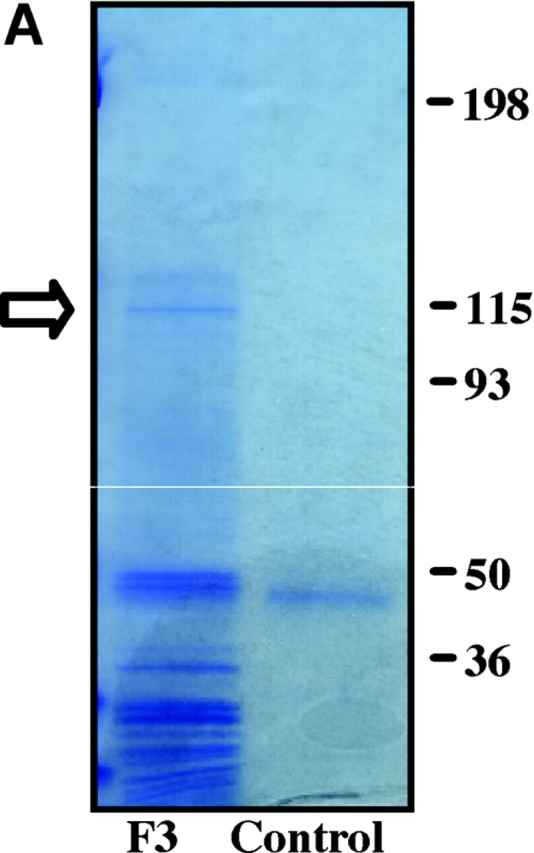
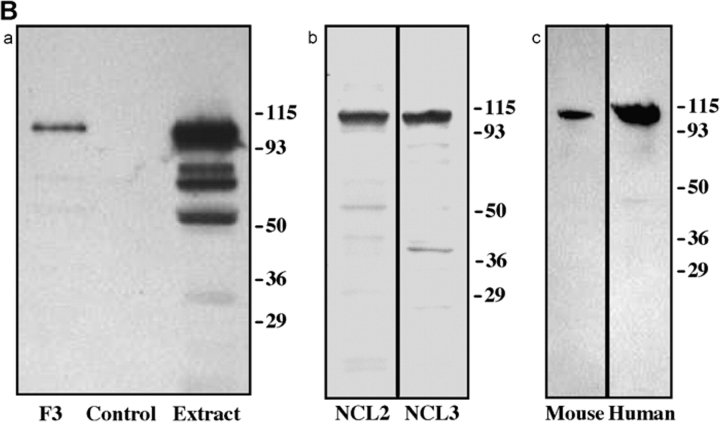
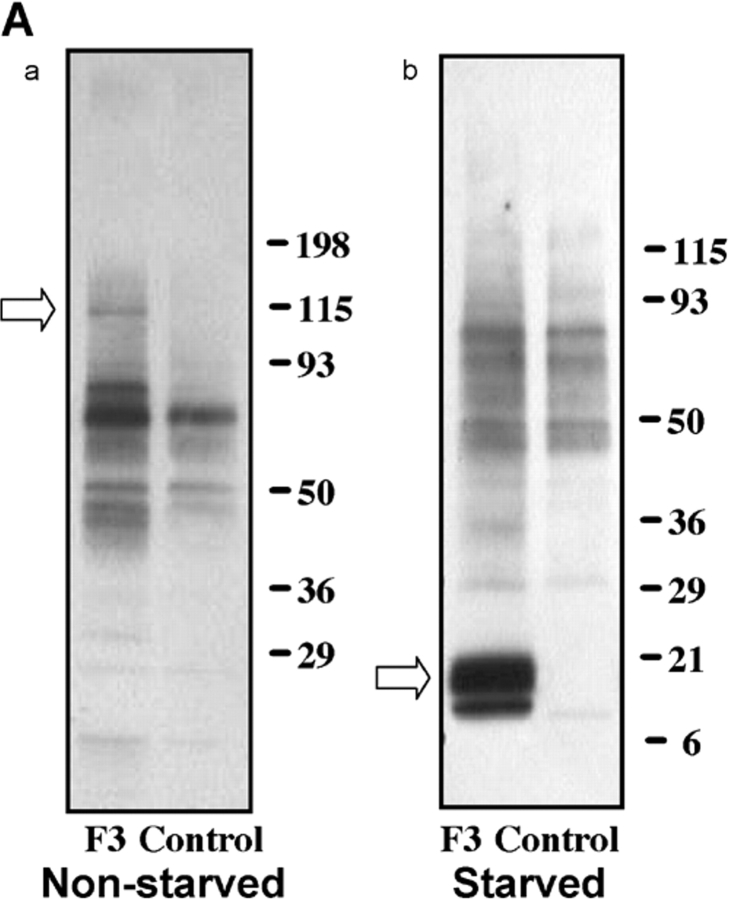
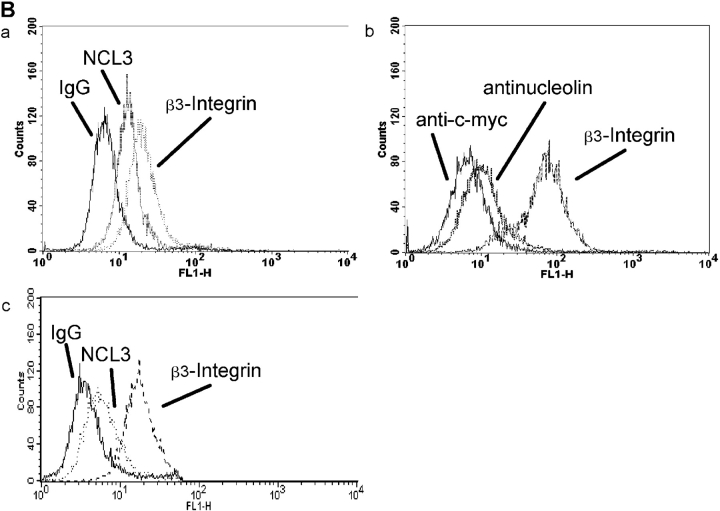
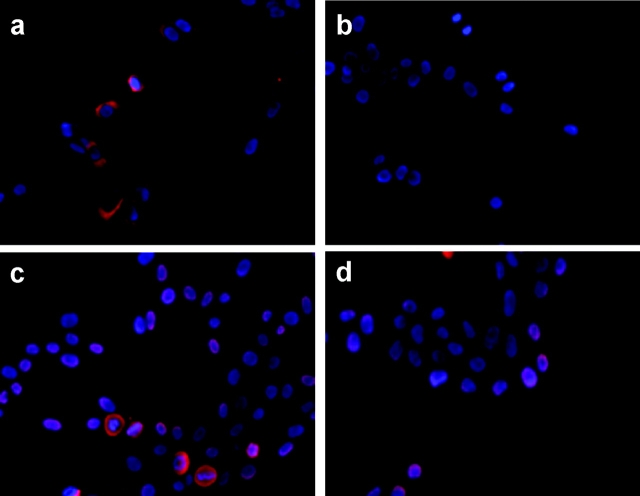
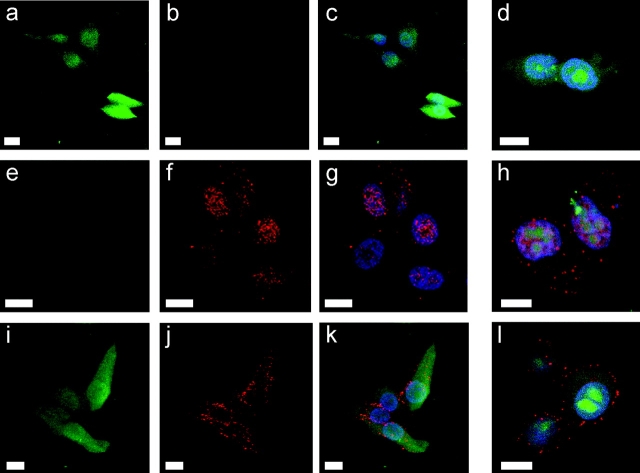
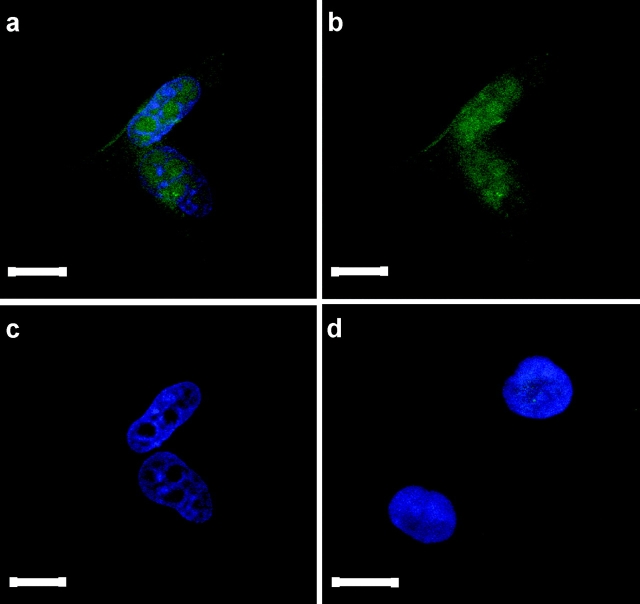
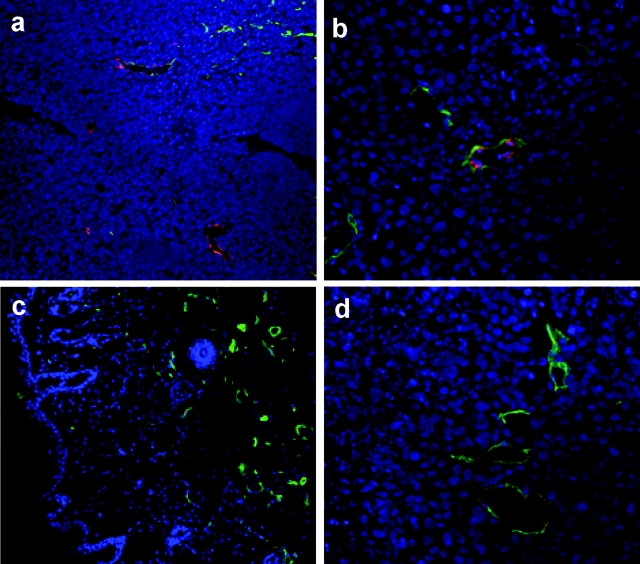
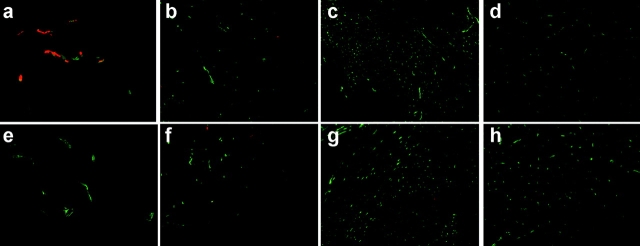
A tumor-homing peptide, F3, selectively binds to endothelial cells in tumor blood vessels and to tumor cells. Here, we show that the cell surface molecule recognized by F3 is nucleolin. Nucleolin specifically bound to an F3 peptide affinity matrix from extracts of cultured breast carcinoma cells. Antibodies and cell surface biotin labeling revealed nucleolin at the surface of actively growing cells, and these cells bound and internalized fluorescein-conjugated F3 peptide, transporting it into the nucleus. In contrast, nucleolin was exclusively nuclear in serum-starved cells, and F3 did not bind to these cells. The binding and subsequent internalization of F3 were blocked by an antinucleolin antibody. Like the F3 peptide, intravenously injected antinucleolin antibodies selectively accumulated in tumor vessels and in angiogenic vessels of implanted "matrigel" plugs. These results show that cell surface nucleolin is a specific marker of angiogenic endothelial cells within the vasculature. It may be a useful target molecule for diagnostic tests and drug delivery applications.


Figures

Figure 1.
Figure 1.
Nucleolin binds to immobilized F3 peptide. (A) SDS gel electrophoresis of Coomassie blue–stained proteins isolated from MDA-MB-435 cell extracts on F3 affinity matrix (F3) or control peptide matrix (Control). The arrow indicates a specific 110-kD band, which was identified as nucleolin by mass spectroscopy. (B) Immunoblotting of eluates from F3 and control affinity matrices with a monoclonal mouse antinucleolin antibody (a); immunoblotting of MDA-MB-435 cell extracts with polyclonal rabbit antinucleolin antibodies NCL2 and NCL3 (b); immunoblotting of extracts generated from the human cell line C8161 and the mouse cell line 4T1 with NCL3 (c). The F3 bound material (a, F3) contains full-length nucleolin and a faintly staining 75-kD band. In the original cell extract (a, Extract), the antibody recognizes full-length nucleolin at 110 kD, along with several faster migrating bands (presumably nucleolin fragments), including one at 75 kD. No antinucleolin reactive bands are detected in eluates from the control matrix (a, Control). Affinity-purified polyclonal antibodies NCL2 and NCL3 recognize a band that aligns with the 110-kD nucleolin band in human extracts, and NCL3 crossreacts with mouse nucleolin (c, Mouse). Both antibodies also detect smaller bands that presumably represent nucleolin fragments.
Figure 1.
Figure 1.
Nucleolin binds to immobilized F3 peptide. (A) SDS gel electrophoresis of Coomassie blue–stained proteins isolated from MDA-MB-435 cell extracts on F3 affinity matrix (F3) or control peptide matrix (Control). The arrow indicates a specific 110-kD band, which was identified as nucleolin by mass spectroscopy. (B) Immunoblotting of eluates from F3 and control affinity matrices with a monoclonal mouse antinucleolin antibody (a); immunoblotting of MDA-MB-435 cell extracts with polyclonal rabbit antinucleolin antibodies NCL2 and NCL3 (b); immunoblotting of extracts generated from the human cell line C8161 and the mouse cell line 4T1 with NCL3 (c). The F3 bound material (a, F3) contains full-length nucleolin and a faintly staining 75-kD band. In the original cell extract (a, Extract), the antibody recognizes full-length nucleolin at 110 kD, along with several faster migrating bands (presumably nucleolin fragments), including one at 75 kD. No antinucleolin reactive bands are detected in eluates from the control matrix (a, Control). Affinity-purified polyclonal antibodies NCL2 and NCL3 recognize a band that aligns with the 110-kD nucleolin band in human extracts, and NCL3 crossreacts with mouse nucleolin (c, Mouse). Both antibodies also detect smaller bands that presumably represent nucleolin fragments.
Figure 2.
Figure 2.
Cell surface expression of nucleolin. (A) F3 affinity chromatography of biotin-labeled proteins solubilized from cell surface–biotinylated MDA-MB-435 cells. F3 specifically binds streptavidin-reactive bands at 110 (arrow) and 75 kD in nonstarved cells (a). These bands are not detectable in serum-starved cells, but a set of low molecular mass bands is prominent (b, arrow). (B) FACS® analysis of antibody binding to MDA-MB-435 cells (a and b) and HUVECs (c). Propidium iodide–negative (living) cells were gated for the analysis. Polyclonal antinucleolin NCL3 (a and c) and monoclonal antinucleolin antibody MS-3 (b) cause a shift of the FACS® peak compared with controls (rabbit IgG and an isotype-matched monoclonal antibody with an unrelated specificity, respectively), indicating cell surface expression of nucleolin on the MDA-MB-435 and HUVECs. A positive control, an anti–β3 integrin, gives a strong shift, reflecting a high cell surface expression of this integrin subunit in both types of cells.
Figure 2.
Figure 2.
Cell surface expression of nucleolin. (A) F3 affinity chromatography of biotin-labeled proteins solubilized from cell surface–biotinylated MDA-MB-435 cells. F3 specifically binds streptavidin-reactive bands at 110 (arrow) and 75 kD in nonstarved cells (a). These bands are not detectable in serum-starved cells, but a set of low molecular mass bands is prominent (b, arrow). (B) FACS® analysis of antibody binding to MDA-MB-435 cells (a and b) and HUVECs (c). Propidium iodide–negative (living) cells were gated for the analysis. Polyclonal antinucleolin NCL3 (a and c) and monoclonal antinucleolin antibody MS-3 (b) cause a shift of the FACS® peak compared with controls (rabbit IgG and an isotype-matched monoclonal antibody with an unrelated specificity, respectively), indicating cell surface expression of nucleolin on the MDA-MB-435 and HUVECs. A positive control, an anti–β3 integrin, gives a strong shift, reflecting a high cell surface expression of this integrin subunit in both types of cells.
Figure 3.
Figure 3.
Subcellular distribution of nucleolin in dividing and stationary cells. MDA-MB-435 cells were cultured in standard culture media (a and c) or in media lacking serum (b and d). Nucleolin was detected using polyclonal NCL3 antibody in fixed cells without permeabilizing the cells (a and b) or after permeabilization with Triton X-100 (c and d). Nucleolin appears both on the surface and in the nuclei of the actively growing cells cultured in the standard media, but is exclusively nuclear in serum-starved cells.
Figure 4.
Figure 4.
Antinucleolin antibodies inhibit F3 internalization by cells. Exponentially growing MDA-MB-435 cells were incubated with 1 μM FITC-F3 or FITC-Tat peptide for 2 h at 37°C. FITC-F3 is internalized and transported into the nucleus (a, FITC-F3, green; b, red channel; c, merge). Coincubation with antinucleolin antibody NCL3 inhibits the cellular uptake and subsequent nuclear transport of the peptide (e, F3-FITC, green; f, NCL3, red; g, merge). NCL2 has no influence on uptake of F3 (i, F3-FITC, green; j, NCL2, red; k, merge). Internalization of FITC-Tat peptide (d) is not affected by NCL3 (h) or NCL2 (l). The antibodies were detected with Alexa-594 anti–rabbit IgG (red). Nuclei were stained with DAPI (blue). The images were obtained by confocal microscopy. Bars, 10 μm.
Figure 5.
Figure 5.
Glycosaminoglycan-deficient cells bind and internalize F3. FITC-F3 is internalized by the glycosaminoglycan-deficient pgsA-745 cells and transported into the nucleus. (a) pgsA-745 cells incubated with FITC-F3 and stained with DAPI to visualize the nuclei. (b and c) The same field as in panel a viewed separately for the F3 fluorescence (b) or the nuclear DAPI staining (c). (d) A FITC-labeled control peptide is not internalized by the pgsA-745 cells. The images were obtained by confocal microscopy. Bars, 10 μm.
Figure 6.
Figure 6.
Intravenously injected antinucleolin antibody accumulates in tumor blood vessels. An affinity-purified rabbit antinucleolin antibody (NCL3) was injected into the tail vein of mice bearing MDA-MB-435 xenograft tumors. The tumor and various organs were removed 1 h after the injection, sectioned, and examined for the presence of rabbit IgG using Alexa-594 anti–rabbit IgG (red). Blood vessels were stained with anti-CD31 antibody (green), and nuclei were counterstained with DAPI (blue). The antinucleolin antibody has bound to tumor blood vessels (a and b), but is not seen in the skin (c). Rabbit IgG injected similarly as a control does not bind to tumor blood vessels (d).
Figure 7.
Figure 7.
Cell surface nucleolin is expressed in angiogenic blood vessels. Balb/c nu/nu mice were subcutaneously injected with matrigel supplemented with bFGF. 8 d later, an antinucleolin antibody (NCL3) or control IgG was injected into the tail vein of the mice. The matrigel plugs were removed 1 h after the injection, sectioned, and examined for the presence of rabbit IgG using Alexa-594 anti–rabbit IgG (red). Blood vessels were stained with anti-CD31 antibody (green), and nuclei were counterstained with DAPI (blue). The injected NCL3 colocalizes the blood vessel staining in the matrigel plugs (a), but no injected rabbit IgG is detected in the plugs (e). No specific NCL3 accumulation over the IgG control is seen in any of the tissues examined: b and f, skin; c and g, heart; or d and h, brain. b–d, NCL3; f–h, IgG.

Similar articles

Cited by

References

    1. Akerman, M.E., W.C. Chan, P. Laakkonen, S.N. Bhatia, and E. Ruoslahti. 2002. Nanocrystal targeting in vivo. Proc. Natl. Acad. Sci. USA. 99:12617–12621. - PMC - PubMed
    1. Arap, W., R. Pasqualini, and E. Ruoslahti. 1998. Cancer treatment by targeted drug delivery to tumor vasculature in a mouse model. Science. 279:377–380. - PubMed
    1. Bergers, G., R. Brekken, G. McMahon, T.H. Vu, T. Itoh, K. Tamaki, K. Tanzawa, P. Thorpe, S. Itohara, Z. Werb, and D. Hanahan. 2000. Matrix metalloproteinase-9 triggers the angiogenic switch during carcinogenesis. Nat. Cell Biol. 2:737–744. - PMC - PubMed
    1. Bonnet, H., O. Filhol, I. Truchet, P. Brethenou, C. Cochet, F. Amalric, and G. Bouche. 1996. Fibroblast growth factor-2 binds to the regulatory beta subunit of CK2 and directly stimulates CK2 activity toward nucleolin. J. Biol. Chem. 271:24781–24787. - PubMed
    1. Borer, R.A., C.F. Lehner, H.M. Eppenberger, and E.A. Nigg. 1989. Major nucleolar proteins shuttle between nucleus and cytoplasm. Cell. 56:379–390. - PubMed

Publication types

MeSH terms