. 2003 Dec 2:4:31.
doi: 10.1186/1471-2202-4-31.

Measuring information integration

Affiliations

Measuring information integration

Giulio Tononi et al. BMC Neurosci. .

Abstract

Background: To understand the functioning of distributed networks such as the brain, it is important to characterize their ability to integrate information. The paper considers a measure based on effective information, a quantity capturing all causal interactions that can occur between two parts of a system.

Results: The capacity to integrate information, or Phi, is given by the minimum amount of effective information that can be exchanged between two complementary parts of a subset. It is shown that this measure can be used to identify the subsets of a system that can integrate information, or complexes. The analysis is applied to idealized neural systems that differ in the organization of their connections. The results indicate that Phi is maximized by having each element develop a different connection pattern with the rest of the complex (functional specialization) while ensuring that a large amount of information can be exchanged across any bipartition of the network (functional integration).

Conclusion: Based on this analysis, the connectional organization of certain neural architectures, such as the thalamocortical system, are well suited to information integration, while that of others, such as the cerebellum, are not, with significant functional consequences. The proposed analysis of information integration should be applicable to other systems and networks.


Figures

Figure 1
Figure 1
Schematics of effective information. Shown is a single subset S (grey ellipse) forming part of a larger system X. This subset is bisected into A and B by a bipartition (dotted line). Arrows indicate anatomical connections linking A to B and B to A across the bipartition, as well as linking both A and B to the rest of the system X. Bi-directional arrows indicate intrinsic connections within each subset and within the rest of the system. (Left) All connections are present. (Right) To measure EI(A→B), maximal entropy Hmax is injected into the outgoing connections from A (see Eq. 1). The resulting entropy of the states of B is then measured. Note that A can affect B directly through connections linking the two subsets, as well as indirectly via X.
Figure 2
Figure 2
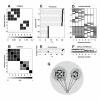
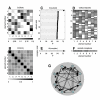
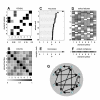
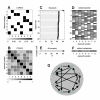
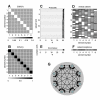
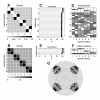
Measuring information integration: An illustrative example. To measure information integration, we performed an exhaustive search of all subsets and bipartitions for a system of n = 8 elements. Noise levels were ci = 0.00001, cp = 1. (A) Connection matrix CON(X). Connections linking elements 1 to 8 are plotted as a matrix of connection strengths (column elements = targets, row elements = sources). Connection strength is proportional to grey level (dark = strong connection, light = weak or absent connection). (B) Covariance matrix COV(X). Covariance is indicated for elements 1 to 8 (corresponding to A). (C) Ranking of the top 25 values for Φ. (D) Element composition of subsets for the top 25 values of Φ (corresponding to panel C). Elements forming the subset S are indicated in grey, with two shades of grey indicating the bipartition into A and B across which the minimal value for EI was obtained. (E) Ranking of the Φ values for all complexes, i.e. subsets not included within subsets of higher Φ. (F) Element composition for the complexes ranked in panel E. (G) Digraph representation of the connections of system X (compare to panel A). Elements are numbered 1 to 8, arrows indicate directed edges, arrow weight indicates connection strength. Grey overlays indicate complexes with grey level proportional to their value of Φ. Figs. 2 to 7 use the same layout to represent computational results.
Figure 3
Figure 3
Information integration and complexes for an optimized network at high SNR. Shown is a representative example for n = 8, w = 0.5, ci = 0.00001, cp = 1. Note the heterogeneous arrangement of the incoming and outgoing connections for each element.
Figure 4
Figure 4
Information integration and complexes for an optimized network at low SNR. Shown is a representative example for n = 8, w = 0.5, ci = 0.1, cp = 1. Note the sparse structure of the optimized connection pattern.
Figure 5
Figure 5
Information integration and complexes for an optimized sparse network having fixed number of connections of equal strength. The network was obtained through an evolutionary rewiring algorithm (n = 8, 16 connections of weight 0.25 each, ci = 0.00001, cp = 1). Note the heterogeneous arrangement of the incoming and outgoing connections for each element, the balanced degree distribution (two afferent and two efferent connections per element) and the low number of direct reciprocal connections.
Figure 6
Figure 6
Information integration and complexes for a homogeneous network. Connectivity is full and all connections weights are the same (n = 8, w = 0.5, ci = 0.00001, cp = 1).
Figure 7
Figure 7
Information integration and complexes for a strong modular network. Weights of inter-modular connections are 0.0417 (n = 8, w = 0.5, ci = 0.00001, cp = 1).
Figure 8
Figure 8
Information integration as a function of modularity – homogeneity. Values of Φ were obtained from Gaussian Toeplitz connection matrices (n = 8) with a fixed amount of total synaptic weight (self-connections allowed). The plot shows Φ as a function of the standard deviation σ of the Toeplitz connection profile. Connection matrices (cases a to f) are shown at the left, for different values of σ. For very low values of σ (σ = 0.001, case a), Φ is zero: the system is made up of 8 causally independent modules. For intermediate values of σ (σ ≈ 0.01 to 0.1, cases b, c, d, e), Φ increases and reaches a maximum; the elements are interacting in a heterogeneous way. For high values of σ (σ = 1, case f) Φ is low; the interactions among the elements are completely homogeneous.
Figure 9
Figure 9
Information integration for basic digraphs. (A) Directed path. (B) One-way cycle. (C) Two-way cycle. (D) Fan-out digraph. (E) Fan-in digraph. Complexes are shaded and values for Φ are provided in each of the panels.
Figure 10
Figure 10
Adding paths and cycles to a main complex. (A) Out-going path added to a complex. Complex and directed path are shown separately on the left and joined on the right. (B) In-coming path added to a complex. (C) Cycle added to a complex. Complexes are shaded and values for Φ are provided in each of the panels.
Figure 11
Figure 11
Joining complexes. (A) Graph representation of two optimized complexes (n = 8 each), joined by reciprocal "inter-modular" connections (stippled arrows). For simplicity, these connections are arranged as n pairs of bi-directional connections, representing a simple topographic mapping. (B) Connection matrix of a network of size n = 16 constructed from two smaller optimized components (n = 8). (C) Information integration as a function of inter-modular coupling strength. Connection strength is given as inter-modular CONij values; all intra-modular connections per element add up to 0.5-CONij. Plot at the bottom shows the size of the complex with highest Φ as a function of inter-modular coupling strength.

References

    1. Shannon CE, Weaver W. The mathematical theory of communication. Urbana: University of Illinois Press; 1949.
    1. Cover TM, Thomas JA. Elements of information theory. New York: Wiley; 1991.
    1. Rieke F. Spikes : exploring the neural code. Cambridge, Mass.: MIT Press; 1997.
    1. Dan Y, Atick JJ, Reid RC. Efficient coding of natural scenes in the lateral geniculate nucleus: experimental test of a computational theory. J Neurosci. 1996;16:3351–3362. - PMC - PubMed
    1. Tononi G, Edelman GM, Sporns O. Complexity and the integration of information in the brain. Trends Cognit Sci. 1998;2:44–52. - PubMed

Publication types

LinkOut - more resources