. 2003 Dec;85(6):3558-74.
doi: 10.1016/S0006-3495(03)74775-4.

Model of bacterial band formation in aerotaxis

Affiliations

Model of bacterial band formation in aerotaxis

B C Mazzag et al. Biophys J. 2003 Dec.

Abstract

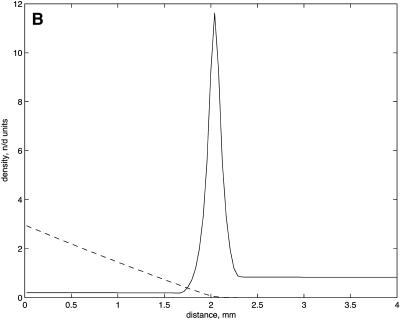
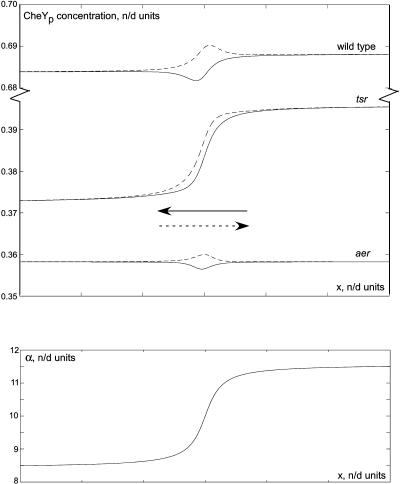
Aerotaxis is a particular form of "energy taxis". It is based on a largely elusive signal transduction machinery. In aerotaxis, oxygen dissolved in water plays the role of both attractant (at moderate concentrations) and repellent (at high and low concentrations). Cells swimming from favorable oxygen concentrations into regions with unfavorable concentrations increase the frequency of reversals, turn back into the favorable domain, and become effectively trapped there. At the same time, bacteria consume oxygen, creating an oxygen gradient. This behavior leads to a pattern formation phenomenon: bacteria self-organize into a dense band at a certain distance from the air-water interface. We incorporate experimental observations of the aerotactic bacterium, Azospirillum brasilense, into a mathematical model. The model consists of a system of differential equations describing swimming bacterial cells and diffusing oxygen. The cells' frequency of reversals depends on the concentration of oxygen and its time derivative while oxygen is depleted by the bacteria. We suggest a hypothetical model of energy sensing mediated by aerotactic receptors Aer and Tsr. Computer simulations and analysis of the model equations allow comparisons of theoretical and experimental results and provide insight into the mechanisms of bacterial pattern formation and underlying signal transduction machinery. We make testable predictions about position and density of the bacterial band.


Figures

FIGURE 1
FIGURE 1
Schematic illustration of the spatial assay for Azospirillum brazilense aerotaxis (based on Fig. 2 of Zhulin et al. (1996)). The bacterial band of width formula image mm (dark) forms at formula image mm from the meniscus (dashed line on the left). Cells rarely reverse as they swim across the band, or as they swim into the band at its edges (straight arrows), whereas they reverse often outside the band, or as they swim away from the band at its edges (bent arrows). Bacterial density behind the band (medium dark) is significantly lower than that in the band. The density in front of the band (light) is orders of magnitude lower than that behind the band. The oxygen concentration (dash-dotted line) decreases linearly from the constant level at the meniscus to almost zero at the edge of the band.
FIGURE 2
FIGURE 2
(a) Internal cell energy, E, as the function of the oxygen concentration, L, in the model (based on observations of Zhulin et al. (1996)). Note that the oxygen concentration is descending to the right to make this figure consistent with Fig. 1. The reversal frequency versus the energy, E, in the model at increasing (solid line) and decreasing (dashed line) energy. (c). The reversal frequency of the right-swimming (dashed line) and left-swimming (solid line) cells in the stationary oxygen gradient decreasing from left to right.
FIGURE 3
FIGURE 3
Model for energy sensing. Decrease in the proton motive force triggers conformational changes in two aerotactic receptors (Aer, Tsr formula image Aer*, Tsr*), which induce fast phosphorylation of CheY increasing reversal frequency. Methylation-dependent adaptation pathway associated with Tsr together with methylation-independent adaptation pathway based on dephosphorylation of CheYp by CheZ are responsible for temporal comparison of the cell energy.
FIGURE 4
FIGURE 4
Snapshots from the numerical simulations of the model equations at t = 10 and 20 s and 1 and 5 min. Bacterial density (solid line) and oxygen concentration (dashed line) are shown. Initially, the bacterial density is constant, and oxygen concentration is zero everywhere. The following parameters were used: formula image. In D, the bottom plate shows the position of the aerotactic band in the oxygen gradient. The meniscus is the arc at the left. This plate was obtained as described in “Materials and Methods” in Zhulin et al. (1996).
FIGURE 4
FIGURE 4
Snapshots from the numerical simulations of the model equations at t = 10 and 20 s and 1 and 5 min. Bacterial density (solid line) and oxygen concentration (dashed line) are shown. Initially, the bacterial density is constant, and oxygen concentration is zero everywhere. The following parameters were used: formula image. In D, the bottom plate shows the position of the aerotactic band in the oxygen gradient. The meniscus is the arc at the left. This plate was obtained as described in “Materials and Methods” in Zhulin et al. (1996).
FIGURE 5
FIGURE 5
Band location, density, and width depends on the oxygen concentration at the meniscus. (A and B) Bacterial densities (solid line) and oxygen concentration (dashed line) at L0 = 10% (A) and at L0 = 30% (B) are shown. (C) Bacterial densities at L0 = 0.4% (solid line) and at L0 = 0.2% (dotted line) are shown. All results correspond to t = 5 min, initial constant bacterial density and zero oxygen density, formula image.
FIGURE 5
FIGURE 5
Band location, density, and width depends on the oxygen concentration at the meniscus. (A and B) Bacterial densities (solid line) and oxygen concentration (dashed line) at L0 = 10% (A) and at L0 = 30% (B) are shown. (C) Bacterial densities at L0 = 0.4% (solid line) and at L0 = 0.2% (dotted line) are shown. All results correspond to t = 5 min, initial constant bacterial density and zero oxygen density, formula image.
FIGURE 6
FIGURE 6
Dependence of the band location, density, and width on model parameters. The solid line shows the bacterial density developed at 5 min from the initial constant density. Dashed line shows the developed oxygen concentration. (A) The case corresponding to aer mutant: all parameters are as in Fig. 4, except formula image = 0.1%, and parameter (Ff) is decreased by 70%. (B) The case corresponding to tsr mutant: all parameters are as in Fig. 4, except Lmax = 2%, and parameter (Ff) is decreased by 30%. In the simulations, the energy-sensing model of E. coli is coupled with the swimming behavior model of A.b.
FIGURE 6
FIGURE 6
Dependence of the band location, density, and width on model parameters. The solid line shows the bacterial density developed at 5 min from the initial constant density. Dashed line shows the developed oxygen concentration. (A) The case corresponding to aer mutant: all parameters are as in Fig. 4, except formula image = 0.1%, and parameter (Ff) is decreased by 70%. (B) The case corresponding to tsr mutant: all parameters are as in Fig. 4, except Lmax = 2%, and parameter (Ff) is decreased by 30%. In the simulations, the energy-sensing model of E. coli is coupled with the swimming behavior model of A.b.
FIGURE 7
FIGURE 7
Simulations of the oxygen-sensing model in swimming E. coli cell. (Bottom) Receptor activation rate as the function of the spatial coordinate corresponds to favorable oxygen at the left and unfavorable oxygen at the right. (Top) Corresponding concentration of the phosphorylated CheY (proportional to the reversal frequency) as the function of the spatial coordinate in the cases of the wild-type cells and aer and tsr mutants The dashed (solid) curves are the reversal frequencies of the right- (left-) swimming cells.
FIGURE 8
FIGURE 8
Steady-state distributions of oxygen (dashed lines) and bacteria (solid lines) found analytically in different regions (IVI) across the capillary. The notations for the densities, concentrations, and distances are explained in the text.

References

    1. Adler, J. 1988. Chemotaxis: old and new. Bot. Acta. 101:93–100.
    1. Alexandre, G., R. Bally, B. L. Taylor, and I. B. Zhulin. 1999. Loss of cytochrome c oxidase activity and acquisition of resistance to quinone analogs in a laccase-positive variant of azospirillum lipoferum. J. Bacteriol. 181:6730–6738. - PMC - PubMed
    1. Alexandre, G., and I. B. Zhulin. 2001. More than one way to sense chemicals. J. Bacteriol. 183:4681–4686. - PMC - PubMed
    1. Almogy, G., L. Stone, and N. Ben-Tal. 2001. Multi-stage regulation, a key to reliable adaptive biochemical pathways. Biophys. J. 81:3016–3028. - PMC - PubMed
    1. Barak, R., I. Nur, Y. Okon, and Y. Henis. 1982. Aerotactic response of Azospirillum brasilense. J. Bacteriol. 152:643–649. - PMC - PubMed

Publication types

LinkOut - more resources