. 2003 Dec;85(6):3624-35.
doi: 10.1016/S0006-3495(03)74780-8.

Structure of sphingomyelin bilayers: a simulation study

Affiliations

Structure of sphingomyelin bilayers: a simulation study

S W Chiu et al. Biophys J. 2003 Dec.

Abstract

We have carried out a molecular dynamics simulation of a hydrated 18:0 sphingomyelin lipid bilayer. The bilayer contained 1600 sphingomyelin (SM) molecules, and 50,592 water molecules. After construction and initial equilibration, the simulation was run for 3.8 ns at a constant temperature of 50 degrees C and a constant pressure of 1 atm. We present properties of the bilayer calculated from the simulation, and compare with experimental data and with properties of dipalmitoyl phosphatidylcholine (DPPC) bilayers. The SM bilayers are significantly more ordered and compact than DPPC bilayers at the same temperature. SM bilayers also exhibit significant intramolecular hydrogen bonding between phosphate ester oxygen and hydroxyl hydrogen atoms. This results in a decreased hydration in the polar region of the SM bilayer compared with DPPC. Since our simulation system is very large we have calculated the power spectrum of bilayer undulation and peristaltic modes, and we compare these data with similar calculations for DPPC bilayers. We find that the SM bilayer has significantly larger bending modulus and area compressibility compared to DPPC.


Figures
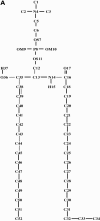
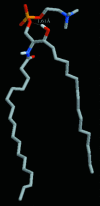
FIGURE 1
FIGURE 1
(a) Single 18:0 SM molecule, showing the atom numbering scheme used. (b) Snapshot of the SM bilayer taken near the end of the simulation trajectory. Water molecules are omitted for clarity.
FIGURE 1
FIGURE 1
(a) Single 18:0 SM molecule, showing the atom numbering scheme used. (b) Snapshot of the SM bilayer taken near the end of the simulation trajectory. Water molecules are omitted for clarity.
FIGURE 2
FIGURE 2
(a) Plot of area per molecule for the large bilayer versus time over 2.8 ns of simulation. (b) Plot of area per molecule for a small SM bilayer (100 SM plus 3162 waters) versus time over a 38-ns simulation.
FIGURE 2
FIGURE 2
(a) Plot of area per molecule for the large bilayer versus time over 2.8 ns of simulation. (b) Plot of area per molecule for a small SM bilayer (100 SM plus 3162 waters) versus time over a 38-ns simulation.
FIGURE 3
FIGURE 3
Plot of electron density profile for the bilayer.
FIGURE 4
FIGURE 4
Plot of order parameter profiles for the bilayer. (Solid line) The acyl chain; (dashed line) the sphingosine chain.
FIGURE 5
FIGURE 5
Plot of RDF between SM amide hydrogens and carbonyl oxygens.
FIGURE 6
FIGURE 6
Plot of the RDF between amide hydrogen and hydroxyl oxygen.
FIGURE 7
FIGURE 7
Plots of RDF calculated between the ester oxygen, OS11, and the hydroxyl hydrogen, H37.
FIGURE 8
FIGURE 8
Plot of the RDF calculated between the ester oxygen, OS7, and the hydroxyl hydrogen, H37.
FIGURE 9
FIGURE 9
Snapshot of an SM molecule with intramolecular hydrogen bond identified.
FIGURE 10
FIGURE 10
Plot of the angular distribution function for the P–N dipole vector. The angle is measured from the bilayer normal so that 90° represents a vector pointing parallel to the bilayer plane.
FIGURE 11
FIGURE 11
Plot of the dipole potential profile for the large bilayer.
FIGURE 12
FIGURE 12
Plots of intensity versus wavenumber for (a) undulation fluctuations and (b) peristaltic fluctuations.
FIGURE 12
FIGURE 12
Plots of intensity versus wavenumber for (a) undulation fluctuations and (b) peristaltic fluctuations.

References

    1. Ahmed, S. N., D. A. Brown, and E. London. 1997. On the origin of sphingolipid/cholesterol rich detergent-insoluble cell membranes: physiological concentrations of cholesterol and sphingolipid induce formation of a detergent-insoluble liquid-ordered lipid phase in model membranes. Biochemistry. 36:10944–10953. - PubMed
    1. Allen, M. P., and D. J. Tildesley. 1987. Computer Simulation of Liquids. Clarendon Press, Oxford, UK.
    1. Aman, M. J., and K. S. Ravichandran. 2000. A requirement for lipid rafts in B-cell receptor induced Ca2+ flux. Curr. Biol. 10:393–396. - PubMed
    1. Armen, R. S., O. D. Uitto, and S. E. Feller. 1998. Phospholipid component volumes: determination and application to bilayer structure calculations. Biophys. J. 74:734–744. - PMC - PubMed
    1. Berger, O., O. Edholm, and F. Jahnig. 1997. Molecular dynamics simulations of a fluid bilayer of dipalmitoylphosphatidylcholine at full hydration, constant pressure, and constant temperature. Biophys. J. 72:2002–2013. - PMC - PubMed

Publication types