. 2003 Dec;85(6):3718-29.
doi: 10.1016/S0006-3495(03)74788-2.

Residue ionization and ion transport through OmpF channels

Affiliations

Residue ionization and ion transport through OmpF channels

Ekaterina M Nestorovich et al. Biophys J. 2003 Dec.

Abstract

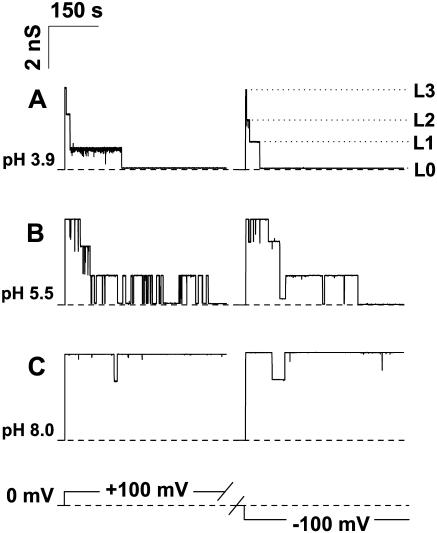
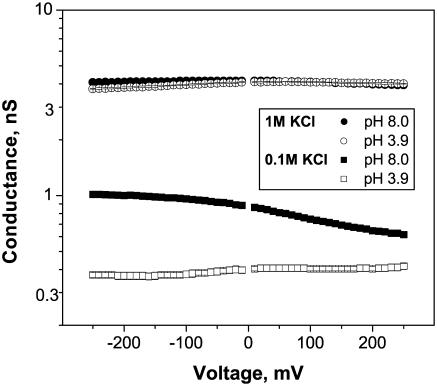
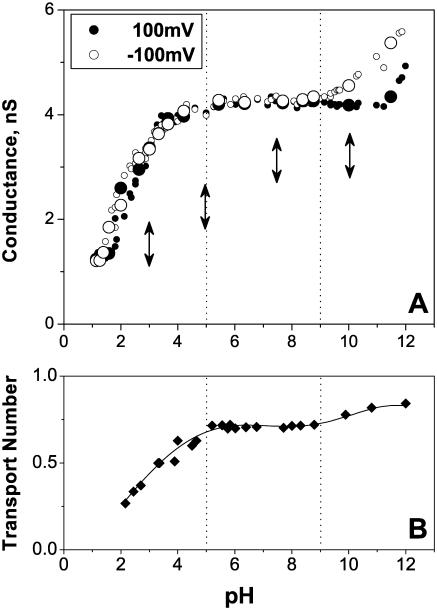
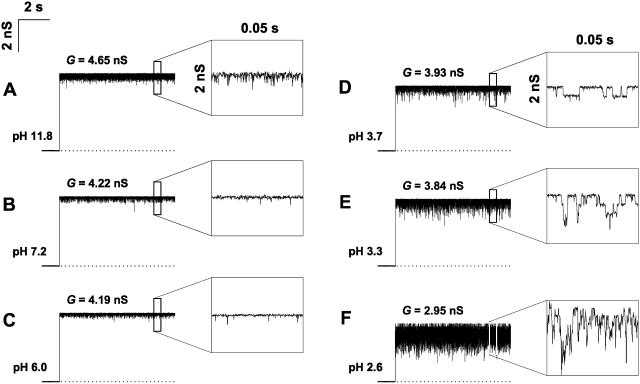
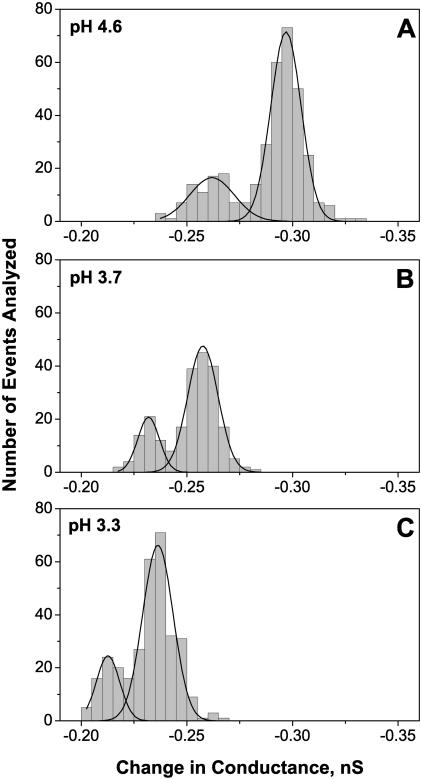
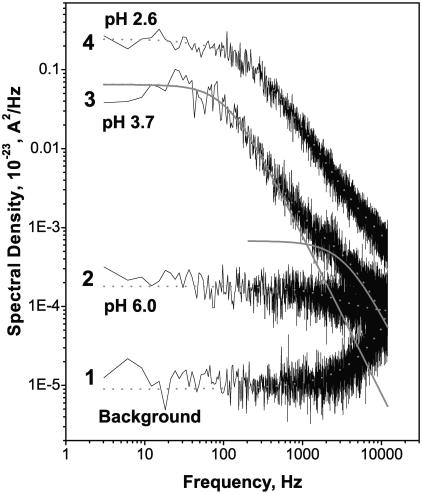
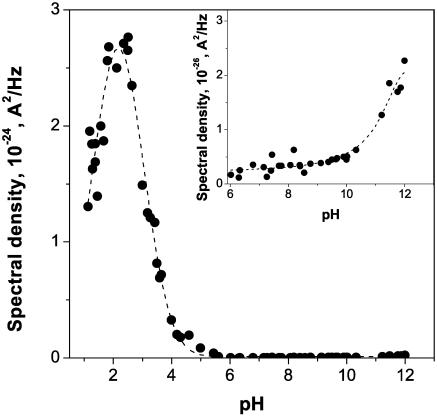
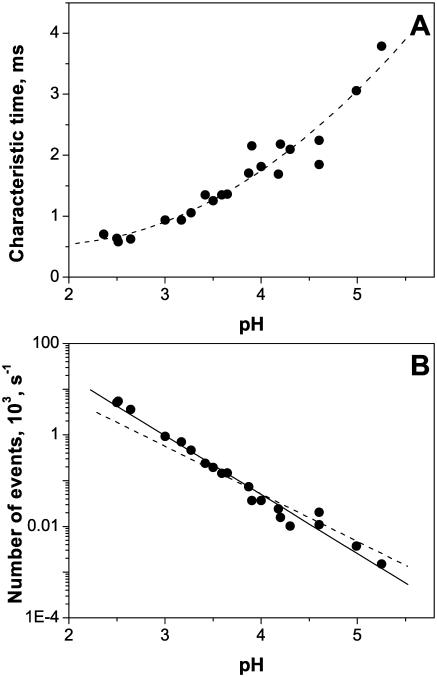
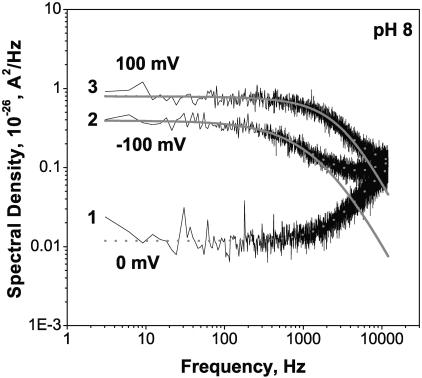
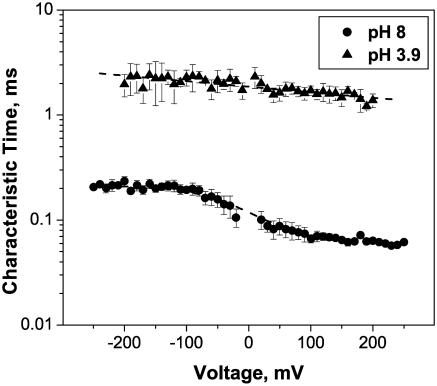
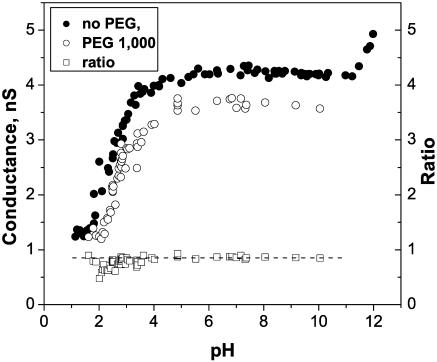
Single trimeric channels of the general bacterial porin, OmpF, were reconstituted into planar lipid membranes and their conductance, selectivity, and open-channel noise were studied over a wide range of proton concentrations. From pH 1 to pH 12, channel transport properties displayed three characteristic regimes. First, in acidic solutions, channel conductance is a strong function of pH; it increases by approximately threefold as the proton concentration decreases from pH 1 to pH 5. This rise in conductance is accompanied by a sharp increase in cation transport number and by pronounced open-channel low-frequency current noise with a peak at approximately pH 2.5. Random stepwise transients with amplitudes at approximately 1/5 of the monomer conductance are major contributors to this noise. Second, over the middle range (pH 5/pH 9), channel conductance and selectivity stay virtually constant; open channel noise is at its minimum. Third, over the basic range (pH 9/pH 12), channel conductance and cation selectivity start to grow again with an onset of a higher frequency open-channel noise. We attribute these effects to the reversible protonation of channel residues whose pH-dependent charge influences transport by direct interactions with ions passing through the channel.


Figures

FIGURE 1
FIGURE 1
Typical tracks of ion conductance for single trimeric OmpF channels reconstituted into planar lipid membranes at pH 3.9 (A), pH 5.5 (B), and pH 8.0 (C) demonstrate that voltage-induced channel closure is facilitated by low pH. The membrane was formed from DPhPC, the membrane bathing solutions contained 1 M KCl and 5 mM HEPES or MES. Time averaging was 100 ms. The dashed lines show zero current levels, the dotted lines in A designate a fully open state (L3, all thee monomers open), and two partially closed states (L2, two monomers open; L1, one monomer open). Note the presence of residual conductance (L0) after the total three-step closure (A, B).
FIGURE 2
FIGURE 2
Average conductance of a fully open channel as a function of applied voltage for different bathing solution concentrations: 1 M KCl (circles) and 0.1 M KCl (squares) at pH 8 (solid symbols) and pH 3.9 (unfilled symbols). Note that the curves have different asymmetry depending on the solution pH. When the voltage changes from −200 mV to 200 mV, the channel conductance grows at pH 3.9 and decreases at pH 8 for both KCl concentrations. Each curve was obtained as a result of averaging of conductance-voltage characteristics for 3–4 independent experiments with different channels.
FIGURE 3
FIGURE 3
(A) Average conductance of a fully open channel drops by a factor of 4 when bathing solution pH is shifted from pH 12 to pH 1. This is true for both positive (solid circles, 100 mV) and negative (unfilled circles, −100 mV) voltages. The data were obtained in four independent experiments with four different single channels. Only one channel was reconstituted in each case. Vertical arrows show initial pH values used for insertions. For example, enlarged circles show the data for the channel inserted at pH 10. Bathing solutions concentration was 1 M KCl. Dashed lines separate three regions of conductance behavior. (B) Ion selectivity of a fully open single channel, given as potassium transport number, t+, depends on solution pH. Three regions can be distinguished in the potassium transport number versus pH curve. The middle region (pH 5–pH 9) shows a constant, slightly cationic selectivity of OmpF; the “acidic” region demonstrates a gradual decrease of cationic selectivity and its inversion to anionic one. The “basic” region displays some growth in cationic selectivity.
FIGURE 4
FIGURE 4
Changing pH changes ion current through a fully open channel in at least two ways. First, the increase in proton concentration decreases both the average current and the maximum current, measured using 0.1-ms averaging. Second, it changes the character of current fluctuations. At pH values close to neutral, (B and C) ion current is most stable and only rare fast downward transients are seen at a finer timescale of the insets on the right. Low pH (D) considerably increases intensity of the open channel noise; stepwise current transients with the amplitude corresponding to ∼1/5 of one monomer conductance are easily resolved (inset). Further solution acidification increases the frequency of these transients (E and F) decreasing the average conductance of the fully open channel. At pH 2.6, the maximum conductance is also decreased by ∼20% in comparison with neutral pH (data in F versus data in B). In basic solutions (A) channel conductance is higher than at neutral pH. Current noise increases at high pH, but the time-resolved stepwise current transients are not observed (inset). Recordings were obtained in 1 M KCl bathing solution under 100 mV of applied voltage. Time resolution for all graphs was 0.1 ms.
FIGURE 5
FIGURE 5
Conductance histograms of the time-resolved stepwise transients induced by low pH (Fig. 4) at pH 4.6 (A), pH 3.7 (B), and pH 3.3 (C). Two peaks on each curve correspond to two clearly defined smaller conductance substates. The amplitudes of these peaks are equal to (0.26 ± 0.02) nS and (0.30 ± 0.01) nS for pH 4.6, (0.23 ± 0.01) nS and (0.26 ± 0.01) nS for pH 3.7, and (0.21 ± 0.01) nS and (0.24 ± 0.01) nS for pH 3.3. Within the statistical error, the ratio of areas under the peaks is independent of solution pH.
FIGURE 6
FIGURE 6
Power spectral density of noise in the current through a single fully open channel increases as pH of 1 M KCl solution is shifted to lower values. Background spectrum (curve 1) was measured for the membrane with a single OmpF channel at 0 mV. The low-frequency noise of the channel at pH 6.0 (curve 2) is orders-of-magnitude smaller than the noise of the same channel at pH 3.7 (curve 3). At f < 500 Hz the spectra of low-pH fluctuations can be approximated by single Lorentzians (shown for curve 3). Except for the background spectrum, the applied voltage was 100 mV.
FIGURE 7
FIGURE 7
The low-frequency spectral density of current noise versus pH dependence has a pronounced peak at ∼pH 2.5. Noise at the maximum exceeds noise at neutral pH by approximately three orders of magnitude. As pH is shifted from 6 to 9 (inset), the noise stays at its lowest; however, subsequent pH increase leads to the increase in noise spectral density. The spectral density of the background (curve 1 in Fig. 6) was subtracted. Applied voltage was 100 mV. 1 M KCl was used as a bathing solution.
FIGURE 8
FIGURE 8
(A) The characteristic time of the noise produced by the stepwise transients, τ, obtained by fitting Eq. 1 to noise spectra, depends on the bathing solution pH. At pH ∼ 5.3 it is close to 4 ms. Changing pH from 5.3 to 2.5 causes more than fourfold decrease in the characteristic time. (B) The frequency of the transients (number of events per second) increases with proton concentration. Bathing solution was 1 M KCl. Applied voltage was 100 mV.
FIGURE 9
FIGURE 9
Power spectral density and corner frequency of noise in the current through a single fully open channel depend on the applied voltage. The difference spectra, obtained by subtracting the background spectrum measured at 0 mV (curve 1), are described by Lorentzians (solid lines) with characteristic times of ∼0.2 ms for −100 mV (curve 2) and 0.07 ms for 100 mV (curve 3). Bathing solution was 1 M KCl.
FIGURE 10
FIGURE 10
The characteristic time of the open channel noise in both basic (pH 8) and acidic (pH 3.9) 1 M KCl solutions as functions of the applied voltage. Even though the characteristic times of these two process differ by an order of magnitude (0.06 ÷ 0.2 ms at pH 8 and 1.5 ÷ 2.5 ms at pH 3.9), both curves show similar voltage asymmetry, giving 70% (pH 8) and 40% (pH 3.9) higher values at −200 mV than at 200 mV.
FIGURE 11
FIGURE 11
Addition of 15% (w/w) PEG 1000 to the membrane-bathing solution of 1 M KCl decreases channel conductance over the whole pH range studied (unfilled circles, 100 mV of applied voltage). Solid circles represent data for the OmpF conductance in pure KCl solutions (Fig. 3 A, solid circles). Unfilled squares are the ratio of channel conductance in the presence of polymer to its conductance in polymer-free solutions. The horizontal dotted line is drawn as the average ratio over the pH range of the conductance plateau, from pH 5.0 to pH 9.0.

References

    1. Bainbridge, G., H. Mobasheri, G. A. Armstrong, E. J. A. Lea, and J. H. Lakey. 1998a. Voltage-gating of E. coli porin: a cystine-scanning mutagenesis study of loop 3. J. Mol. Biol. 275:171–176. - PubMed
    1. Bainbridge, G., I. Gokce, and J. H. Lakey. 1998b. Voltage gating is a fundamental feature of porin and toxin β-barrel membrane channels. FEBS Lett. 431:305–308. - PubMed
    1. Bayley, H., and P. S. Cremer. 2001. Stochastic sensors inspired by biology. Nature. 413:226–230. - PubMed
    1. Benson, S. A., J. L. Occi, and B. A. Sampson. 1988. Mutations that alter the pore function of the OmpF porin of E. coli K12. J. Mol. Biol. 203:961–970. - PubMed
    1. Benz, R., and K. Bauer. 1988. Permeation of hydrophilic molecules through the outer membrane of gram-negative bacteria. Review on bacterial porins. Eur. J. Biochem. 176:1–19. - PubMed

LinkOut - more resources