

Docosahexaenoic acid and other fatty acids induce a decrease in pHi in Jurkat T-cells
- PMID: 14645139
- PMCID: PMC1574148
- DOI: 10.1038/sj.bjp.0705563
Docosahexaenoic acid and other fatty acids induce a decrease in pHi in Jurkat T-cells
Abstract
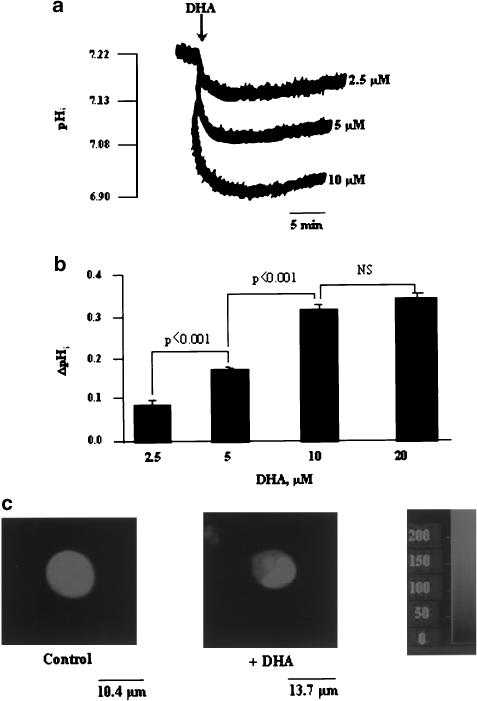
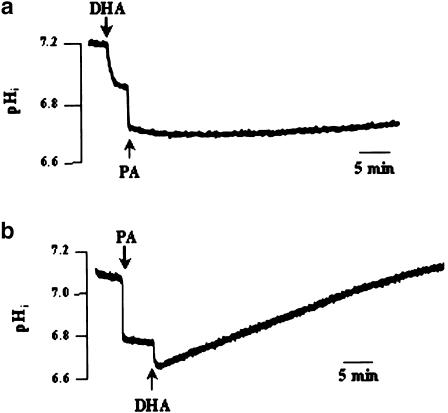
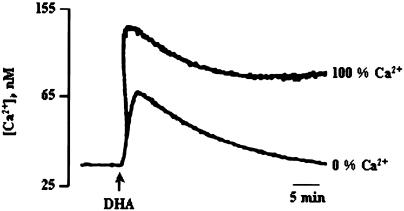
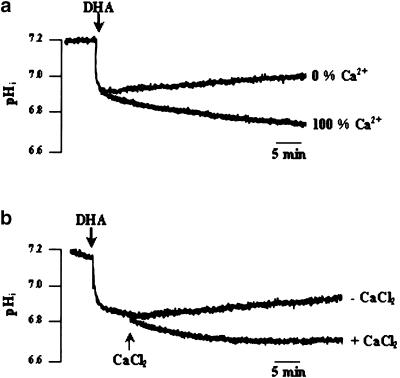
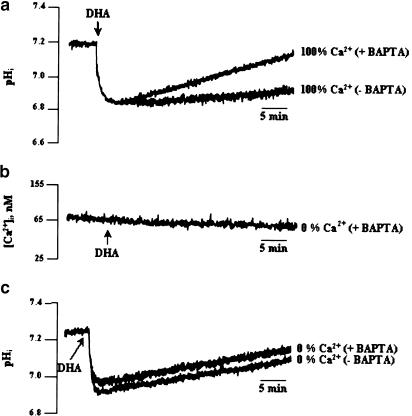
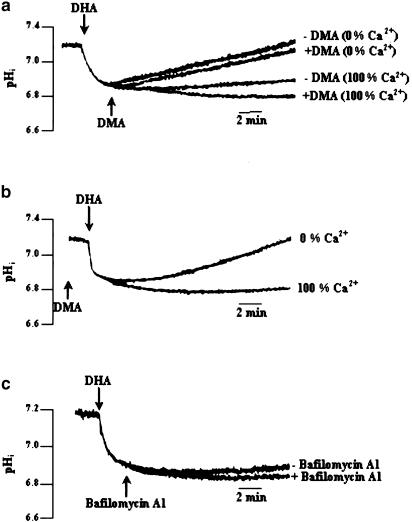
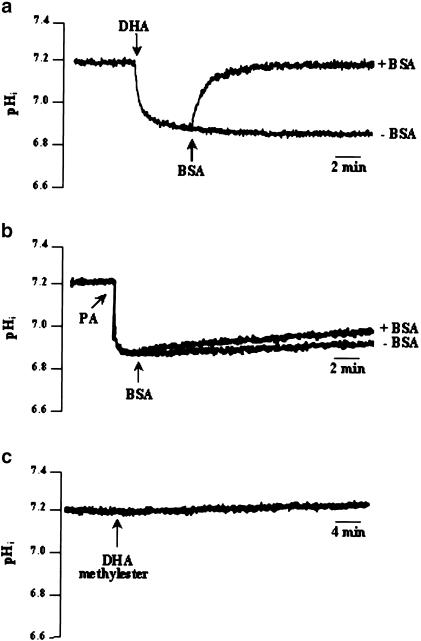
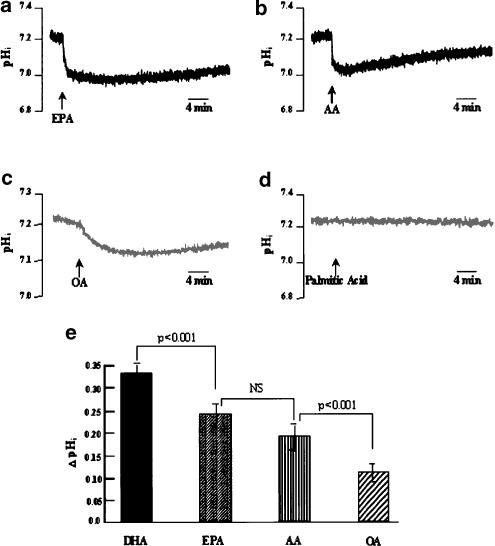
1. Docosahexaenoic acid (DHA) induced rapid (t1/2=33 s) and dose-dependent decreases in pHi in BCECF-loaded human (Jurkat) T-cells. Addition of 5-(N,N-dimethyl)-amiloride, an inhibitor of Na+/H+ exchanger, prolonged DHA-induced acidification as a function of time, indicating that the exchanger is implicated in pHi recovery. 2. Other fatty acids like oleic acid, arachidonic acid, eicosapentaenoic acid, but not palmitic acid, also induced a fall in pHi in these cells. 3. To assess the role of calcium in the DHA-induced acidification, we conducted experiments in Ca2+-free (0% Ca2+) and Ca2+-containing (100% Ca2+) buffer. We observed that there was no difference in the degree of DHA-induced transient acidification in both the experimental conditions, though pHi recovery was faster in 0% Ca2+ medium than that in 100% Ca2+ medium. 4. In the presence of BAPTA, a calcium chelator, a rapid recovery of DHA-induced acidosis was observed. Furthermore, addition of CaCl2 into 0% Ca2+ medium curtailed DHA-evoked rapid pHi recovery. In 0% Ca2+ medium, containing BAPTA, DHA did not evoke increases in [Ca2+]i, though this fatty acid still induced a rapid acidification in these cells. These observations suggest that calcium is implicated in the long-lasting DHA-induced acidosis. 5. DHA-induced rapid acidification may be due to its deprotonation in the plasma membrane (flip-flop model), as suggested by the following observations: (1) DHA with a -COOH group induced intracellular acidification, but this fatty acid with a -COOCH3 group failed to do so, and (2) DHA, but not propionic acid, -induced acidification was completely reversed by addition of fatty acid-free bovine serum albumin in these cells. 6. These results suggest that DHA induces acidosis via deprotonation and Ca2+ mobilization in human T-cells.
Figures
Similar articles
-
Intracellular acidification and Ca2+ transients in cultured rat cerebellar astrocytes evoked by glutamate agonists and noradrenaline.Glia. 1995 Jun;14(2):153-61. doi: 10.1002/glia.440140210. Glia. 1995. PMID: 7558242
-
Arachidonic acid-induced H+ and Ca2+ increases in both the cytoplasm and nucleoplasm of rat cerebellar granule cells.J Physiol. 2001 Dec 1;537(Pt 2):497-510. doi: 10.1111/j.1469-7793.2001.00497.x. J Physiol. 2001. PMID: 11731581 Free PMC article.
-
Docosahexaenoic acid and signaling pathways in rabbit colon.Mol Pharmacol. 1994 Apr;45(4):737-46. Mol Pharmacol. 1994. PMID: 8183254
-
Inhibition of astroglial glutamate transport by polyunsaturated fatty acids: evidence for a signalling role of docosahexaenoic acid.Neurochem Int. 2009 Jul;54(8):535-43. doi: 10.1016/j.neuint.2009.02.018. Epub 2009 Mar 5. Neurochem Int. 2009. PMID: 19428799
-
Human dendritic cell activities are modulated by the omega-3 fatty acid, docosahexaenoic acid, mainly through PPAR(gamma):RXR heterodimers: comparison with other polyunsaturated fatty acids.J Leukoc Biol. 2008 Oct;84(4):1172-82. doi: 10.1189/jlb.1007688. Epub 2008 Jul 16. J Leukoc Biol. 2008. PMID: 18632990
Cited by
-
Crosstalk between Helicobacter pylori and gastric epithelial cells is impaired by docosahexaenoic acid.PLoS One. 2013;8(4):e60657. doi: 10.1371/journal.pone.0060657. Epub 2013 Apr 5. PLoS One. 2013. PMID: 23577140 Free PMC article.
-
The Influence of Dietary Fatty Acids on Immune Responses.Nutrients. 2019 Dec 6;11(12):2990. doi: 10.3390/nu11122990. Nutrients. 2019. PMID: 31817726 Free PMC article. Review.
-
Fatty Acid Metabolism and T Cells in Multiple Sclerosis.Front Immunol. 2022 May 4;13:869197. doi: 10.3389/fimmu.2022.869197. eCollection 2022. Front Immunol. 2022. PMID: 35603182 Free PMC article. Review.
-
Effects of the polyunsaturated fatty acids, EPA and DHA, on hematological malignancies: a systematic review.Oncotarget. 2018 Feb 5;9(14):11858-11875. doi: 10.18632/oncotarget.24405. eCollection 2018 Feb 20. Oncotarget. 2018. PMID: 29545942 Free PMC article. Review.
-
SSO and other putative inhibitors of FA transport across membranes by CD36 disrupt intracellular metabolism, but do not affect FA translocation.J Lipid Res. 2020 May;61(5):790-807. doi: 10.1194/jlr.RA120000648. Epub 2020 Feb 26. J Lipid Res. 2020. PMID: 32102800 Free PMC article.
References
-
- AMRI E.Z., AILHAUD G., GRIMALDI P.A. Fatty acids as signal transducing molecules: involvement in the differentiation of preadipose to adipose cells. J. Lipid Res. 1994;35:930–937. - PubMed
-
- ANEL A., RICHIERI G.V., KLEINFELD A.M. Membrane partition of fatty acids and inhibition of T cell function. Biochemistry. 1993;32:530–536. - PubMed
-
- ASTASHKIN E.I., KHODOROVA A.B., SURIN A.M. Arachidonic acid abolishes the mitogen-induced increase in cytosolic free Ca2+ and intracellular pHi in rat thymocytes. FEBS Lett. 1993;329:72–74. - PubMed
-
- BATES D., CARTLIDGE N.E.F., FRENCH J.M., JACKSON M.J., NIGHTINGALE S., SHAW D.A., SMITH S., WOO E., HAWKINS S.A., MILLAR J.H.D., BELIN J., CONROY D.M., GILL S.K., SIDEY M., SMITH A.D., THOMPSON R.H.S., ZILKHA K., GALE M., SINCLAIR H.M. A double-blind controlled trial of long-chain n-3 polyunsaturated fatty acids in the treatment of multiple sclerosis. J. Neurol. Neurosurg. Psychiatry. 1989;52:18–22. - PMC - PubMed
-
- BERTHE P., COUSIN J.L., BREITTMAYER J.P. Intracellular Ca2+ regulation in CD3 stimulated Jurkat T cells involves H+ fluxes. Cell. Signal. 1991;3:453–459. - PubMed
Publication types
MeSH terms
Substances
LinkOut - more resources
Full Text Sources
Miscellaneous
