Comparative Study
. 2003 Dec;140(7):1331-9.
doi: 10.1038/sj.bjp.0705471.

N-salicyloyltryptamine, a new anticonvulsant drug, acts on voltage-dependent Na+, Ca2+, and K+ ion channels

Affiliations
Comparative Study

N-salicyloyltryptamine, a new anticonvulsant drug, acts on voltage-dependent Na+, Ca2+, and K+ ion channels

Démetrius Antonio Machado Araújo et al. Br J Pharmacol. 2003 Dec.

Abstract

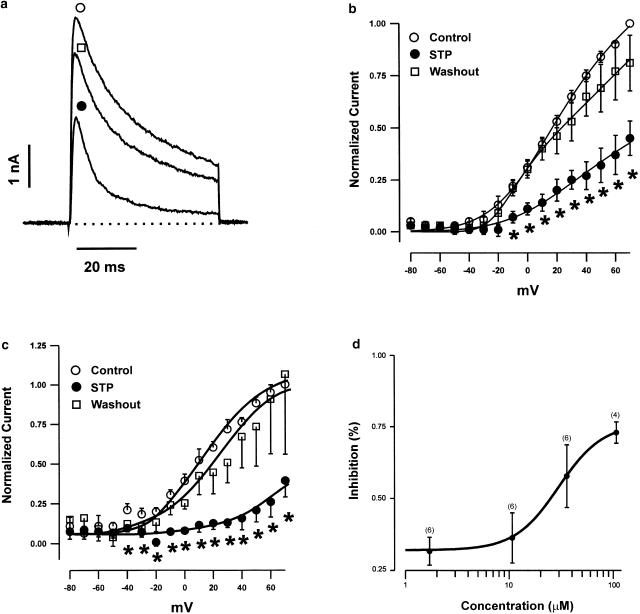
1. The aim of this work was to study the effects of N-salicyloyltryptamine (STP), a novel anticonvulsant agent, on voltage-gated ion channels in GH3 cells. 2. In this study, we show that STP at 17 microM inhibited up to 59.2+/-10.4% of the Ito and 73.1+/-8.56% of the IKD K+ currents in GH3 cells. Moreover, the inhibitory activity of the drug STP on K+ currents was dose-dependent (IC50=34.6+/-8.14 microM for Ito) and partially reversible after washing off. 3. Repeated stimulation at 1 Hz (STP at 17 microM) led to the total disappearance of Ito current, and an enhancement of IKD. 4. In the cell-attached configuration, application of STP to the bath increased the open probability of large-conductance Ca2+-activated K+ channels. 5. STP at 17 microM inhibited the L-type Ca2+ current by 54.9+/-7.50% without any significant changes in the voltage dependence. 6. STP at 170 microM inhibited the TTX-sensitive Na+ current by 22.1+/-2.41%. At a lower concentration (17 microM), no effect on INa was observed. 7. The pharmacological profile described here might contribute to the neuroprotective effect exerted by this compound in experimental 'in vivo' models.


Figures

Figure 1
Figure 1
STP decreased Na+ currents in GH3 cells. (a) Current tracings elicited by step depolarizations from −80 to 0 mV for 20 ms duration, before 170 μM STP (1), under STP (2), and after the removal of STP (3). (b) Upper panel – typical time course of INa, for a representative GH3 cell elicited by 170 μM STP. STP induced a decrease of INa amplitude (2) that was almost completely reversed by washing out the drug (3). Bottom panel – lack of frequency dependence of STP block in GH3 cells. Na+ channels were activated with a test pulse to 0 mV (20 ms), from a holding potential of −80 mV at 2 Hz. There were no significant differences in the amount of block when pulses were applied at higher frequencies. (c) Current–voltage relationship of INa in control conditions (open circles, n=5), in the presence of 170 μM STP (closed circles, n=5), and after washout (open squares, n=5). The bars represent mean±s.e.m. (d) Summary of the effects of STP on INa. STP-induced inhibition is expressed as percentage of control. The control peak current measured at 0 mV was considered as 100% (blank bar graph). Values are mean±s.e.m. with five different experiments. *Statistically different at P<0.05.
Figure 2
Figure 2
STP inhibits Ba2+ currents in GH3 cells. (a) Whole-cell Ba2+ currents are activated by test pulses from −80 to 0 mV every 5 s. Control condition (1), in the presence of 17 μM STP (2) and after STP removal (3). (b) Representative time course of the amplitude of IBa, measured every 5 s at 0 mV (holding potential, −80 mV). The cell was first exposed to control extracellular solution. Application of STP (17 μM) induced a significant inhibition (2). After washout, IBa did not return to basal amplitude (3). (c) Mean IV relationships of Ba2+ currents. Peak inward current normalized to cell capacitance plotted vs test potential for cells recorded in the absence (open circles, n=5), and during STP application (filled circles, n=5). Note that the peak value shifted to the left when the cells were exposed to STP. (d) Percentage block of whole-cell Ba2+ currents by STP (17 μM, n=5). The control peak current measured at +10 mV was considered as 100% (blank bar graph). In all experiments, the holding potential was −80 mV, and 5 mM Ba2+ was used as charge carrier. *Statistically different from control (P<0.05).
Figure 3
Figure 3
Effect of STP on voltage-dependent outward K+ currents in GH3 cells. (a) Current records elicited by step depolarization before (open circle), during the perfusion of 17 μM STP (closed circle), and after STP washout (open square). IV plots of both the maximal Ito current amplitudes (b), and the mean current at the end of the 50 ms test pulses (c) are shown. Data are mean±s.e.m. of either Ito or IKD current values, normalized to the respective maximal current amplitude measured at +70 mV. (d) Dose–response relationship showing the effect of STP on Ito currents. The percentage of current inhibition corresponds to the fraction of the peak current that is inhibited by different concentrations of STP, compared with the control value of peak current measured at +70 mV. Data points were obtained from 4–6 cells, and were fit by a logistic function (see text for details).
Figure 4
Figure 4
Use-dependent effects induced by STP. Original records obtained in the absence (a) and presence (b) of STP, when applying 20 depolarizing pulses (300 ms in duration) from −80 to +50 mV, at a frequency of 1 Hz. (c) Plot of normalized current under control conditions (open circles) and in the presence of 17 μM STP (closed circles) as a function of the number of pulses. The peak amplitudes of the current at every pulse were normalized to the peak amplitudes of current obtained at the first pulse.
Figure 5
Figure 5
Effect of STP on the activity of Maxi-K channels in cell-attached patches. GH3 cells were bathed in high K+ solution (150 mM). The cell was held at +70 mV and the original current record was obtained in control and during the STP application (17 μM) into the bath. Panel (a(1)) shows a typical control record. Panel (b(1)) depicts current traces showing the change in the activity of Maxi-K channels after the addition of STP. Channel openings are shown as an upward deflection. Panels (a(2)) and (b(2)) represent the amplitude histograms in the absence and presence of STP, respectively. All data points shown in the amplitude histograms were fitted by two Gaussian distributions, using the method of maximum likelihood. The closed state corresponds to the peak at 0 pA. (a-3) Shows the calculated open probability for control, and in the presence of STP (17 μM).

References

    1. BARRETT J.N., MAGLEBY K.L., PALLOTTA B.S. Properties of single calcium activated potassium channels in cultured rat muscle. J. Physiol. (Lond.) 1982;331:211–230. - PMC - PubMed
    1. BEIRAO P.S.L., DAVIES N.W., STANFIELD P.R. Inactivating ‘ball' peptide from Shaker B blocks Ca2+-activated but not ATP-dependent K+ channels of rat skeletal muscle. J. Physiol. (Lond.) 1994;474:269–274. - PMC - PubMed
    1. BEZANILLA F., ARMSTRONG C.M. Inactivation of the sodium channel. I. Sodium current experiments. J. Gen. Physiol. 1977;70:549–566. - PMC - PubMed
    1. BONIFACIO M.J., SHERIDAN R.D., PARADA A., CUNHA R.A., PATMORE L., SOARES-DA-SILVA P. Interaction of the novel anticonvulsant, BIA 2-093, with voltage-gated sodium channels: comparison with carbamazepine. Epilepsia. 2001;42:600–608. - PubMed
    1. CUI J., COX D.H., ALDRICH R.W. Intrinsic voltage dependence and Ca2+ regulation of mslo large conductance Ca-activated K+ channels. J. Gen. Physiol. 1997;109:647–673. - PMC - PubMed

Publication types

LinkOut - more resources