. 2003 Dec;185(24):7053-67.
doi: 10.1128/JB.185.24.7053-7067.2003.

Responses of the central metabolism in Escherichia coli to phosphoglucose isomerase and glucose-6-phosphate dehydrogenase knockouts

Affiliations

Responses of the central metabolism in Escherichia coli to phosphoglucose isomerase and glucose-6-phosphate dehydrogenase knockouts

Qiang Hua et al. J Bacteriol. 2003 Dec.

Abstract

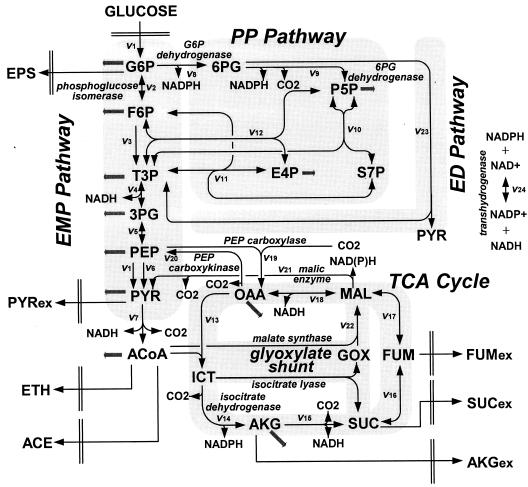
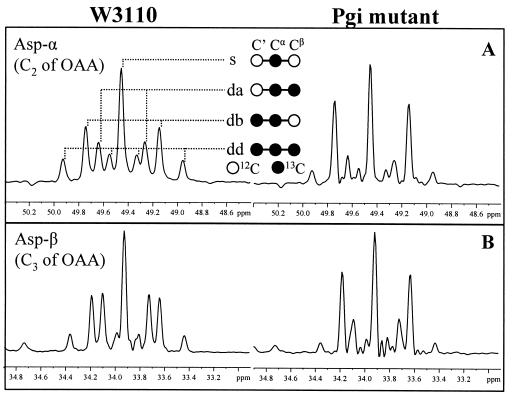
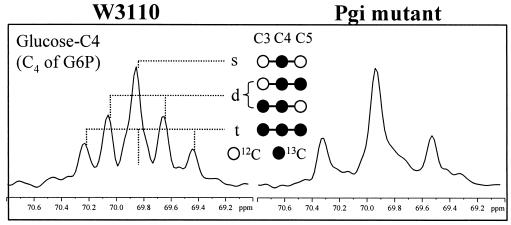
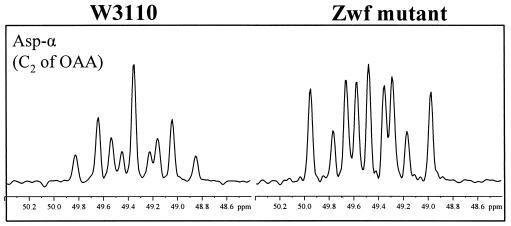
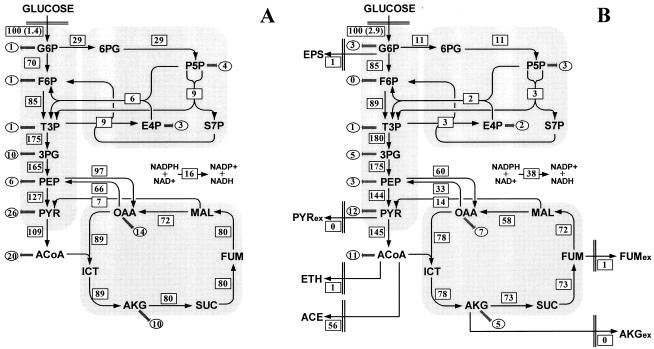
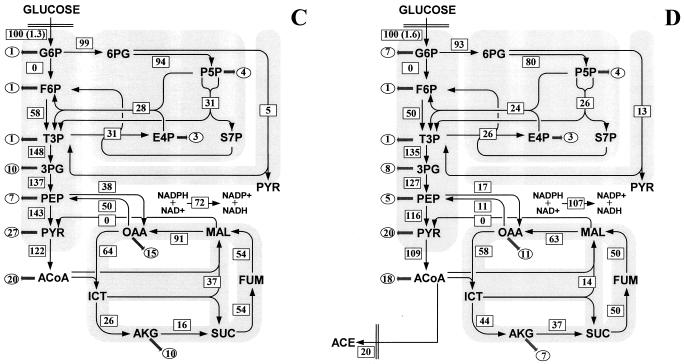
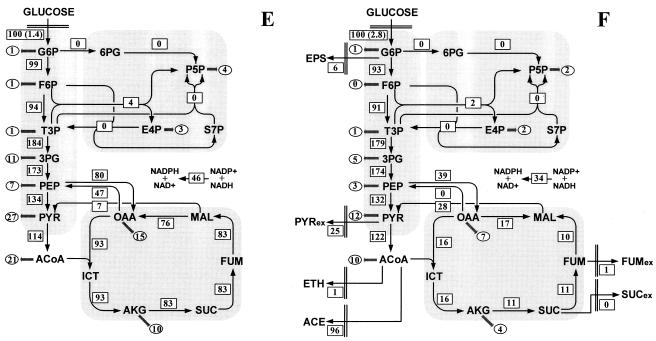
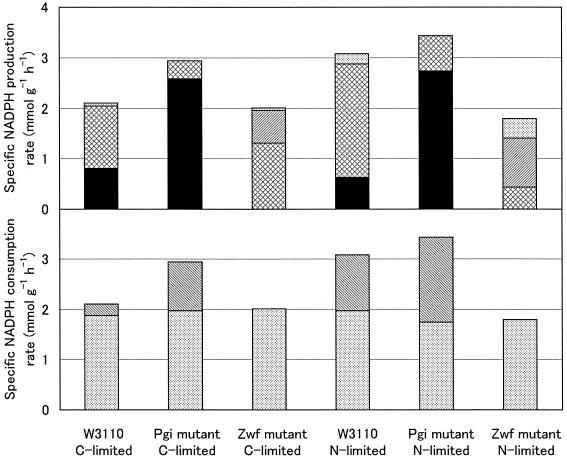
The responses of Escherichia coli central carbon metabolism to knockout mutations in phosphoglucose isomerase and glucose-6-phosphate (G6P) dehydrogenase genes were investigated by using glucose- and ammonia-limited chemostats. The metabolic network structures and intracellular carbon fluxes in the wild type and in the knockout mutants were characterized by using the complementary methods of flux ratio analysis and metabolic flux analysis based on [U-(13)C]glucose labeling and two-dimensional nuclear magnetic resonance (NMR) spectroscopy of cellular amino acids, glycerol, and glucose. Disruption of phosphoglucose isomerase resulted in use of the pentose phosphate pathway as the primary route of glucose catabolism, while flux rerouting via the Embden-Meyerhof-Parnas pathway and the nonoxidative branch of the pentose phosphate pathway compensated for the G6P dehydrogenase deficiency. Furthermore, additional, unexpected flux responses to the knockout mutations were observed. Most prominently, the glyoxylate shunt was found to be active in phosphoglucose isomerase-deficient E. coli. The Entner-Doudoroff pathway also contributed to a minor fraction of the glucose catabolism in this mutant strain. Moreover, although knockout of G6P dehydrogenase had no significant influence on the central metabolism under glucose-limited conditions, this mutation resulted in extensive overflow metabolism and extremely low tricarboxylic acid cycle fluxes under ammonia limitation conditions.


Figures

FIG. 1.
FIG. 1.
Bioreaction network of E. coli central carbon metabolism. The arrows indicate the physiological directions of reactions. Fluxes to biomass building blocks are indicated by gray arrows. Abbreviations: F6P, fructose 6-phosphate; T3P, triose 3-phosphate; 3PG, 3-phosphoglycerate; PYR, pyruvate; ACoA, acetyl coenzyme A; 6PG, 6-phosphogluconate; S7P, seduheptulose 7-phosphate; OAA, oxaloacetate; ICT, isocitrate; AKG, α-ketoglutarate; SUC, succinate; FUM, fumarate; MAL, malate; GOX, glyoxylate; EPS, extracellular polysaccharide; ETH, ethanol; ACE, acetate; ex, extracellular.
FIG. 2.
FIG. 2.
13C-13C scalar coupling multiplets observed for aspartate from glucose-limited chemostat cultures of E. coli W3110 (left) and the Pgi mutant (right). The signals were extracted from the ω1(13C) cross sections in the [13C,1H]-COSY spectra. (A) Asp-α; (B) Asp-β. As indicated in panel A, the multiplets consist of a singlet (s), a doublet with a small coupling constant (Da), a doublet split by a larger coupling constant (db), and a doublet of doublets (dd). Aspartate corresponds directly to its metabolic precursor, oxaloacetate (OAA).
FIG. 3.
FIG. 3.
13C-13C scalar coupling multiplets observed for C-4 of glucose from ammonia-limited chemostat cultures of E. coli W3110 (left) and the Pgi mutant (right). The signals were extracted from the ω1(13C) cross sections in the [13C,1H]-COSY spectra. As glucose C-4 exhibits scalar coupling constants identical to those of the adjacent carbons, the multiplets consist of a singlet (s), a doublet (d), and a triplet (t). The labeling data for glucose represent the labeling patterns of G6P.
FIG. 4.
FIG. 4.
13C-13C scalar coupling multiplets observed for Asp-α from ammonia-limited chemostat cultures of E. coli W3110 (left) and the Zwf mutant (right). The signals were extracted from the ω1(13C) cross sections in the [13C,1H]-COSY spectra. See the legend to Fig. 2 for definitions of multiplet components. Aspartate corresponds directly to its metabolic precursor, oxaloacetate (OAA).
FIG. 5.
FIG. 5.
Metabolic flux distribution in chemostat cultures of E. coli W3110 under glucose-limited conditions (A) and ammonia-limited conditions (B), the Pgi mutant under glucose-limited conditions (C) and ammonia-limited conditions (D), and the Zwf mutant under glucose-limited conditions (E) and ammonia-limited conditions (F). The chemostats were operated at a dilution rate of 0.1 h−1. The numbers in rectangles are the net fluxes determined. The flux values are expressed relative to the specific glucose uptake rate, which is indicated in parentheses (in millimoles per gram [dry weight] per hour). The arrows indicate the directions of the fluxes determined. The numbers in ellipses are the fluxes for withdrawal of precursor metabolites for biomass formation. For abbreviations, see the legend to Fig. 1.
FIG. 5.
FIG. 5.
Metabolic flux distribution in chemostat cultures of E. coli W3110 under glucose-limited conditions (A) and ammonia-limited conditions (B), the Pgi mutant under glucose-limited conditions (C) and ammonia-limited conditions (D), and the Zwf mutant under glucose-limited conditions (E) and ammonia-limited conditions (F). The chemostats were operated at a dilution rate of 0.1 h−1. The numbers in rectangles are the net fluxes determined. The flux values are expressed relative to the specific glucose uptake rate, which is indicated in parentheses (in millimoles per gram [dry weight] per hour). The arrows indicate the directions of the fluxes determined. The numbers in ellipses are the fluxes for withdrawal of precursor metabolites for biomass formation. For abbreviations, see the legend to Fig. 1.
FIG. 6.
FIG. 6.
Specific rates of NADPH production and consumption in glucose (C)- and ammonia (N)-limited chemostat cultures of E. coli W3110, the Pgi mutant, and the Zwf mutant. NADPH production was contributed to by the oxidative PP pathway (solid bars), isocitrate dehydrogenase (cross-hatched bars), transhydrogenase (hatched bars), and malic enzyme (stippled bars). NADPH was consumed via biomass formation(stippled bars) and the transhydrogenase reaction (hatched bars).

Comment in

  • It is all about metabolic fluxes.
    Nielsen J. Nielsen J. J Bacteriol. 2003 Dec;185(24):7031-5. doi: 10.1128/JB.185.24.7031-7035.2003. J Bacteriol. 2003. PMID: 14645261 Free PMC article. Review. No abstract available.

References

    1. Boonstra, B., C. E. French, I. Wainwright, and N. C. Bruce. 1999. The udhA gene of Escherichia coli encodes a soluble pyridine nucleotide transhydrogenase. J. Bacteriol. 181:1030-1034. - PMC - PubMed
    1. Canonaco, F., T. A. Hess, S. Heri, T. Wang, T. Szyperski, and U. Sauer. 2001. Metabolic flux response to phosphoglucose isomerase knock-out Escherichia coli and impact of overexpression of the soluble transhydrogenase UdhA. FEMS Microbiol. Lett. 204:247-252. - PubMed
    1. Choi, I. Y., K. I. Sup, H. J. Kim, and J. W. Park. 2003. Thermosensitive phenotype of Escherichia coli mutant lacking NADP+-dependent isocitrate dehydrogenase. Redox Rep. 8:51-56. - PubMed
    1. Christensen, B., A. K. Gombert, and J. Nielsen. 2002. Analysis of flux estimates based on 13C-labelling experiments. Eur. J. Biochem. 269:2795-2800. - PubMed
    1. Cronan, J. E., Jr., and D. LaPorte. 1996. Tricarboxylic acid cycle and glyoxylate bypass, p. 206-216. In F. C. Neidhardt, R. Curtiss, J. L. Ingraham, E. C. C. Lin, K. B. Low, B. Magasanik, W. S. Reznikoff, M. Riley, M. Schaechter, and H. E. Umbarger (ed.), Escherichia coli and Salmonella: cellular and molecular biology, 2nd ed. ASM Press, Washington, D.C.

Publication types

MeSH terms

Substances