

Correlated discharge among cell pairs within the oculomotor horizontal velocity-to-position integrator
- PMID: 14645478
- PMCID: PMC6740981
- DOI: 10.1523/JNEUROSCI.23-34-10852.2003
Correlated discharge among cell pairs within the oculomotor horizontal velocity-to-position integrator
Abstract
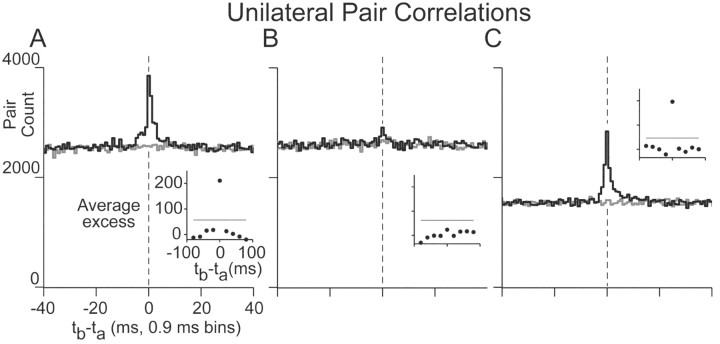
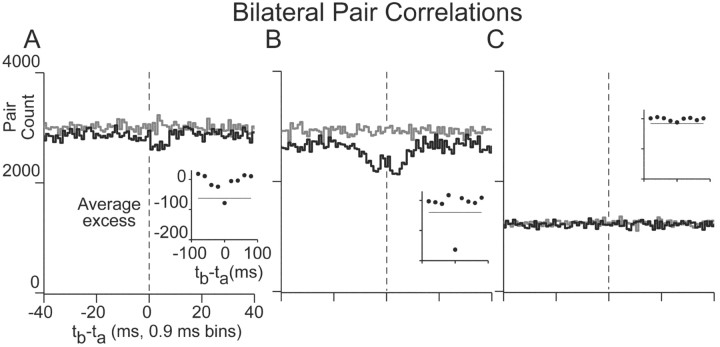
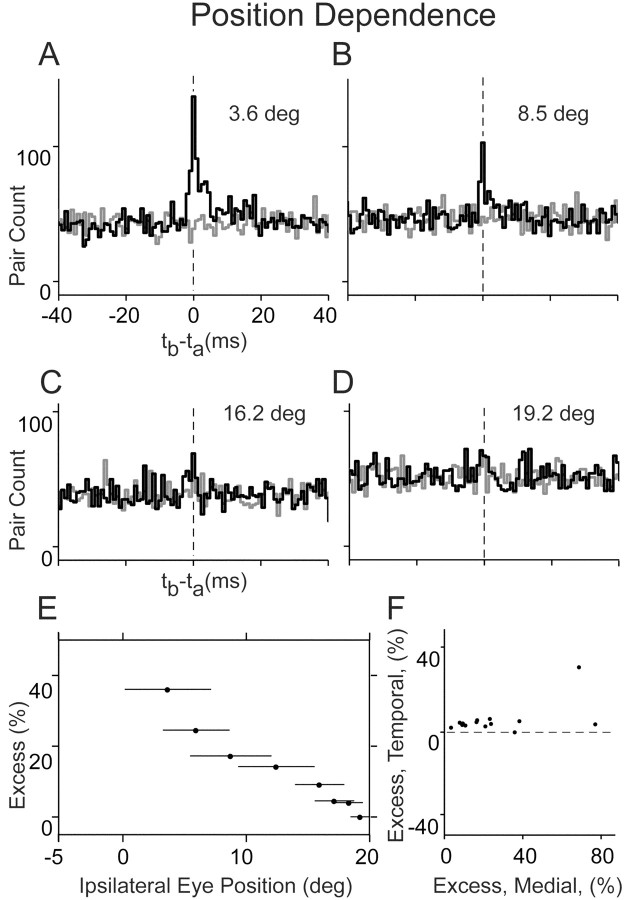
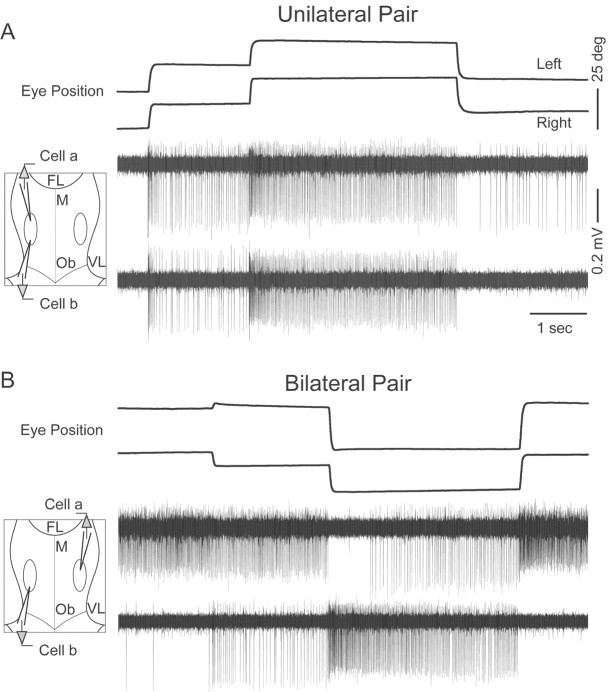
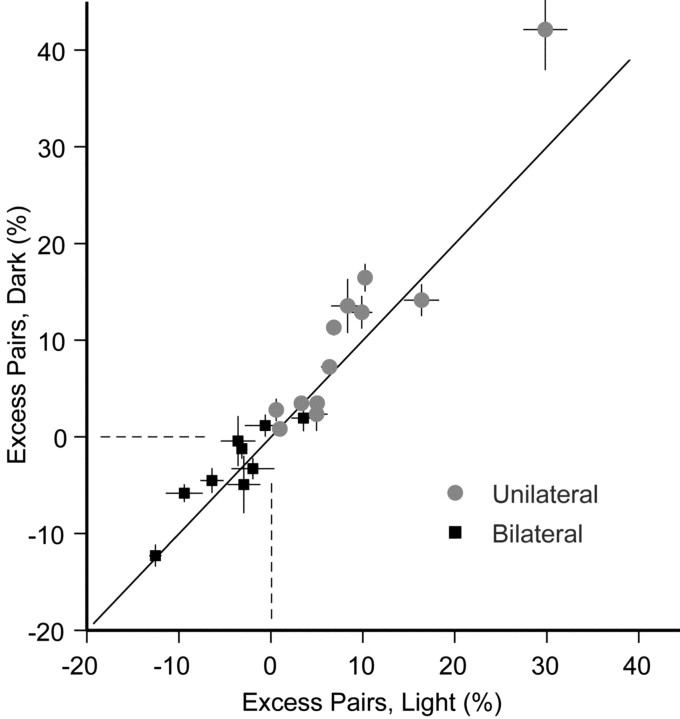
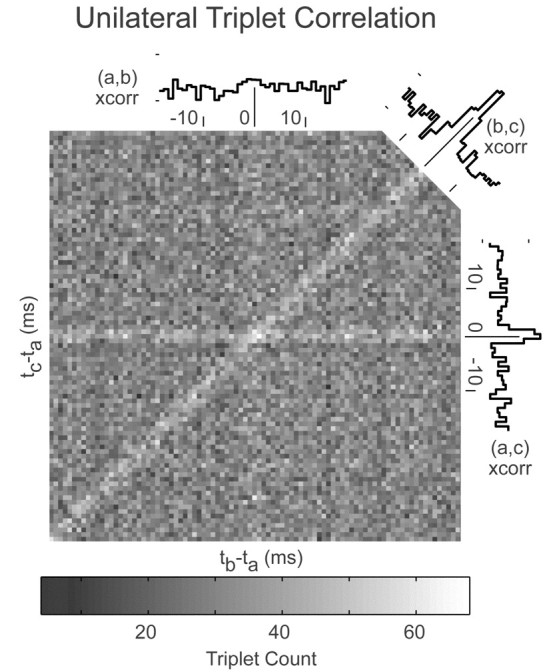
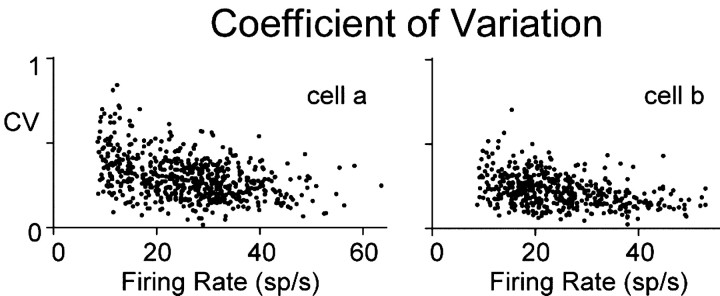
In the oculomotor system, temporal integration of velocity commands into position signals may depend on synaptic feedback among neurons of a bilateral brainstem cell assembly known as the "neural integrator." Both ipsilateral excitatory and contralateral inhibitory projections between eye position-related integrator cells are hypothesized as a substrate for positive feedback supporting integration. Presence of feedback interactions should be evident in cross-correlation functions of neuron pairs. Here, unilateral and bilateral paired recordings were obtained during fixation behavior from neurons in goldfish brainstem area I, a key element of the integrator. During fixations, discharge of most unilateral pairs, composed of cells with eye position sensitivities of the same sign, was positively correlated with lag of 0-10 msec (n = 11 of 14 significant). Typically, a very narrow peak (mean half-width <4 msec) near zero lag was observed. Discharge of bilateral pairs, composed of cells with position sensitivities of the opposite sign, was either negatively correlated with lag of 0-10 msec (n = 5 of 13 significant) or not correlated. Troughs in negative correlations always had minima between 3 and 5 msec lag. These results are consistent with the feedback hypothesis of temporal integration, highlighting excitation unilaterally and inhibition bilaterally. Absence of visual input did not weaken correlations, but other sources of correlated input extrinsic to area I were not ruled out. Triplet recordings revealed that unilateral pairwise correlations were primarily independent. Correlation between unilateral pairs systematically decreased with increasing eye position, demonstrating that synchrony is not necessary for persistent activity at high firing rates.
Figures
Similar articles
-
Anatomy and discharge properties of pre-motor neurons in the goldfish medulla that have eye-position signals during fixations.J Neurophysiol. 2000 Aug;84(2):1035-49. doi: 10.1152/jn.2000.84.2.1035. J Neurophysiol. 2000. PMID: 10938326
-
History dependence of rate covariation between neurons during persistent activity in an oculomotor integrator.Cereb Cortex. 2003 Nov;13(11):1173-84. doi: 10.1093/cercor/bhg099. Cereb Cortex. 2003. PMID: 14576209
-
Encoding of eye position in the goldfish horizontal oculomotor neural integrator.J Neurophysiol. 2011 Feb;105(2):896-909. doi: 10.1152/jn.00313.2010. Epub 2010 Dec 15. J Neurophysiol. 2011. PMID: 21160010 Free PMC article.
-
The interstitial nucleus of Cajal in the midbrain reticular formation and vertical eye movement.Neurosci Res. 1991 Apr;10(3):159-87. doi: 10.1016/0168-0102(91)90055-4. Neurosci Res. 1991. PMID: 1650435 Review.
-
A tale of two species: Neural integration in zebrafish and monkeys.Neuroscience. 2015 Jun 18;296:80-91. doi: 10.1016/j.neuroscience.2014.04.048. Epub 2014 May 2. Neuroscience. 2015. PMID: 24797331 Free PMC article. Review.
Cited by
-
Convergence of excitatory and inhibitory hair cell transmitters shapes vestibular afferent responses.Proc Natl Acad Sci U S A. 2004 Nov 2;101(44):15766-71. doi: 10.1073/pnas.0402824101. Epub 2004 Oct 25. Proc Natl Acad Sci U S A. 2004. PMID: 15505229 Free PMC article.
-
Spatial gradients and multidimensional dynamics in a neural integrator circuit.Nat Neurosci. 2011 Aug 21;14(9):1150-9. doi: 10.1038/nn.2888. Nat Neurosci. 2011. PMID: 21857656 Free PMC article.
-
A cholinergic synaptically triggered event participates in the generation of persistent activity necessary for eye fixation.J Neurosci. 2004 Jun 2;24(22):5109-18. doi: 10.1523/JNEUROSCI.0235-04.2004. J Neurosci. 2004. PMID: 15175380 Free PMC article.
-
Synaptic mechanism for the sustained activation of oculomotor integrator circuits in the rat prepositus hypoglossi nucleus: contribution of Ca2+-permeable AMPA receptors.J Neurosci. 2010 Nov 24;30(47):15735-46. doi: 10.1523/JNEUROSCI.2814-10.2010. J Neurosci. 2010. PMID: 21106813 Free PMC article.
-
Electron Microscopic Reconstruction of Functionally Identified Cells in a Neural Integrator.Curr Biol. 2017 Jul 24;27(14):2137-2147.e3. doi: 10.1016/j.cub.2017.06.028. Epub 2017 Jul 14. Curr Biol. 2017. PMID: 28712570 Free PMC article.
References
-
- Aksay E, Baker R, Seung HS, Tank DW ( 2000) Anatomy and discharge properties of pre-motor neurons in the goldfish medulla that have eye-position signals during fixations. J Neurophysiol 84: 1035-1049. - PubMed
-
- Aksay E, Gamkrelidze G, Seung HS, Baker R, Tank DW ( 2001) In vivo intracellular recording and perturbation of persistent activity in a neural integrator. Nat Neurosci 4: 184-193. - PubMed
-
- Cannon SC, Robinson DA ( 1987) Loss of the neural integrator of the oculomotor system from brain stem lesions in monkey. J Neurophysiol 57: 1383-1409. - PubMed
-
- Cannon SC, Robinson DA, Shamma S ( 1983) A proposed neural network for the integrator of the oculomotor system. Biol Cybern 49: 127-136. - PubMed
MeSH terms
LinkOut - more resources
Full Text Sources
Other Literature Sources