. 2003 Nov 26;23(34):10892-6.
doi: 10.1523/JNEUROSCI.23-34-10892.2003.

Caught in the act: in vivo mapping of macrophage infiltration in nerve injury by magnetic resonance imaging

Affiliations

Caught in the act: in vivo mapping of macrophage infiltration in nerve injury by magnetic resonance imaging

Martin Bendszus et al. J Neurosci. .

Abstract

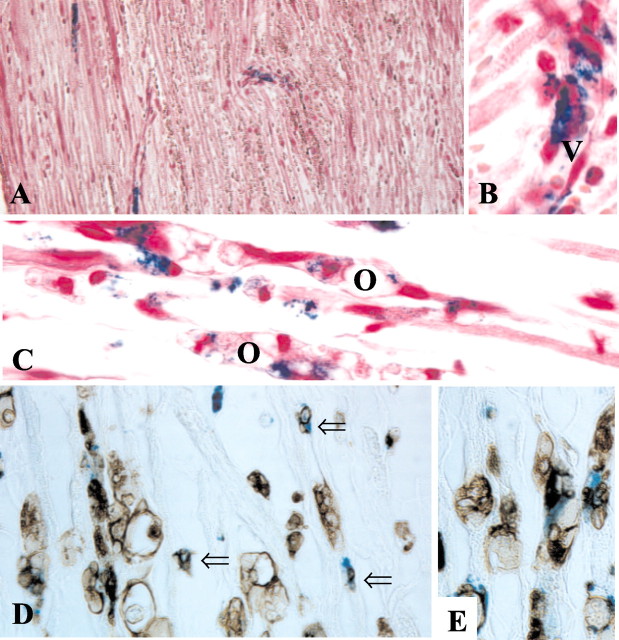
In vivo tracking of hematogenous macrophages has been a major challenge because these cells are key players in nerve injury and repair. We visualized the spatiotemporal course of macrophage infiltration after acute peripheral nerve injury in living rats by using superparamagnetic iron oxide (SPIO) particles and magnetic resonance imaging (MRI). A signal loss on MR images indicating iron accumulation was present in degenerating sciatic nerves between days 1 and 8 after a crush lesion, ceased thereafter, and corresponded to the transient presence of iron-labeled ED1-positive macrophages in tissue sections. In contrast, no SPIO accumulation was seen after optic nerve crush, which revealed microglial activation but lacked macrophage infiltration. SPIO-enhanced MRI provides a new tool to selectively visualize active periods of macrophage transmigration into the nervous system, thus enabling dynamic views on a fundamental process in a multitude of nerve disorders.


Figures

Figure 1.
Figure 1.
MRI of crushed and normal sciatic (A-E) and optic nerves (F): coronal MR images (CISS sequence; slice thickness, 1 mm) at days 1 (A), 3 (B), 5 (C), and 8 (D) after a proximal crush lesion of the left sciatic nerve. SPIO particles were given intracardially 24 hr before MRI at each time point. On day 1, a focal signal loss (arrowhead) is present at the proximal sciatic nerve corresponding to the lesion site (A). On days 3 and 5, the signal loss extends farther into distal nerve segments (B, C, arrowheads). Arrows point to the contralateral normal sciatic nerve revealing an isointense signal to the surrounding soft tissue. On day 8, there is only a moderate signal loss at the lesion site (D, arrowhead). E shows a coronal MR image at day 11 after crush of the left sciatic nerve and at day 5 after crush of the right sciatic nerve in the same animal (sequential crush). Iron-induced signal loss is restricted to the recently crushed right sciatic nerve (arrowheads), whereas the left sciatic nerve crushed 11 d before in the more chronic stage of Wallerian degeneration shows a signal increase (arrow). F, Semicoronal MR image (CISS sequence; angulation along the axis of both optic nerves; slice thickness, 1 mm) 4 d after retro-orbital crush lesion of the left optic nerve and 24 hr after SPIO application. Arrowhead denotes olfactory bulb; arrows point to optic nerves. In contrast to the sciatic nerves, no focal signal loss is present in the crushed optic nerve.
Figure 2.
Figure 2.
Localization and identification of iron-loaded cells in crushed sciatic nerves. Paraffin sections were stained for iron (A-E, blue) and counterstained with hematoxylin to reveal morphological details (A-C) or immunolabeled with antibody ED1 to identify monocytes and macrophages (D, E, brown) at days 1 (A, B) and 5 (C-E) after nerve injury. Note that iron-positive cells at the crush site are closely associated with vessels at day 1 (A). At higher magnification (B), it appears that iron-loaded cells transmigrate through the vessel wall (V) to infiltrate the endoneurium. At day 5 (C), iron-positive cells are associated with degenerating nerve fibers that contain ovoids (O) of degenerating myelin. Iron-positive cells can be identified as ED1+ monocytes and macrophages (D, E, brown). The numerous small iron-ED1+ cells represent monocytes (open arrows), whereas other iron-positive cells are already engaged in myelin phagocytosis as indicated by large ED1+ vacuoles in their cytoplasm. Magnifications (before 33% reduction): A, 370×; B, D, F, 1150×; E, 770×.
Figure 3.
Figure 3.
Time course of macrophage infiltration in crushed sciatic nerves: corresponding sections of distal nerve segments undergoing Wallerian degeneration at days 3 (A, B), 5 (C, D), 8 (E, F), and 14 (G, H) stained for iron (Fe) with Perl's stain (A, C, E, G) and immunocytochemistry (Mφ) with the macrophage marker ED1 (B, D, F, H). ED1 is a lysosomal antigen; its expression in macrophages increases along with their phagocytic activity. Note the increasing density of ED1 labeling from days 3 to 14 (B-H). In contrast, iron labeling is restricted to early time points. At days 3 and 5 (A, C), numerous blue iron-labeled macrophages are present. At day 8, only small clusters of iron-positive cells are detectable (E), whereas at day 14 virtually no iron deposits are found in the endoneurium (G), despite the persistence of large numbers of ED1+ macrophages (H). These findings correspond to the transient signal loss on MRI as shown in Figure 1. Magnifications (before 33% reduction): A-H, 140×.

References

    1. Banati RB ( 2002) Visualising microglial activation in vivo. Glia 40: 206-217. - PubMed
    1. Benveniste EN ( 1997) Role of macrophages/microglia in multiple sclerosis and experimental allergic encephalomyelitis. J Mol Med 75: 165-173. - PubMed
    1. Brück W ( 1997) The role of macrophages in Wallerian degeneration. Brain Pathol 7: 741-752. - PMC - PubMed
    1. Casselman JW, Kuhweide R, Deimling M, Ampe W, Dehaene I, Meeus L ( 1993) Constructive interference in steady state-3DFT MR imaging of the inner ear and cerebellopontine angle. AJNR Am J Neuroradiol 14: 47-57. - PMC - PubMed
    1. Chen F, Ward J, Robinson PJ ( 1999) MR imaging of the liver and spleen: a comparison of the effects on signal intensity of two superparamagnetic iron oxide agents. Magn Reson Imaging 17: 549-556. - PubMed

Publication types

MeSH terms