. 2003 Nov 26;23(34):10923-33.
doi: 10.1523/JNEUROSCI.23-34-10923.2003.

Sustained Ca2+ entry elicits transient postsynaptic currents at a retinal ribbon synapse

Affiliations

Sustained Ca2+ entry elicits transient postsynaptic currents at a retinal ribbon synapse

Joshua H Singer et al. J Neurosci. .

Abstract

Night (scotopic) vision is mediated by a distinct retinal circuit in which the light responses of rod-driven neurons are faster than those of the rods themselves. To investigate the dynamics of synaptic transmission at the second synapse in the rod pathway, we made paired voltage-clamp recordings from rod bipolar cells (RBCs) and postsynaptic AII and A17 amacrine cells in rat retinal slices. Depolarization of RBCs from -60 mV elicited sustained Ca2+ currents and evoked AMPA receptor (AMPAR)-mediated EPSCs in synaptically coupled amacrine cells that exhibited large, rapidly rising initial peaks that decayed rapidly to smaller, steady-state levels. The transient component persisted in the absence of feedback inhibition to the RBC terminal and when postsynaptic AMPA receptor desensitization was blocked with cyclothiazide, indicating that it reflects a time-dependent decrease in the rate of exocytosis from the presynaptic terminal. The EPSC waveform was similar when RBCs were recorded in perforated-patch or whole-cell configurations, but asynchronous release from RBCs was enhanced when the intraterminal Ca2+ buffer capacity was reduced. When RBCs were depolarized from -100 mV, inactivating, low voltage-activated (T-type channel-mediated) Ca2+ currents were evident. Although Ca2+ influx through T-type channels boosted vesicle release, as reflected by larger EPSCs, it did not make the EPSCs faster, indicating that activation of T-type channels is not necessary to generate a transient phase of exocytosis. We conclude that the time course of vesicle release from RBCs is inherently transient and, together with the fast kinetics of postsynaptic AMPARs, speeds transmission at this synapse.


Figures

Figure 1.
Figure 1.
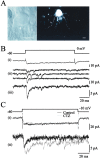
Synaptic transmission at the RBC-AII synapse. A, Left, Retinal slice visualized by IR-DIC microscopy. Arrows indicate somata of an AII amacrine cell (yellow) and an RBC (red). Right, Distinctive morphologies of an AII (yellow) and an RBC (red) visualized with fluorescent tracers in a different slice. Scale bar, 10 μm. B, Responses elicited when a presynaptic RBC is stepped from -60 to -10 mV for 100 msec. i, Single, raw presynaptic currents elicited under control conditions (red traces; external solution containing TTX only), with 100 μm picrotoxin (Pic.) added (black traces), or with 100 μm picrotoxin and 50 μm TPMPA added (blue traces). Traces have been offset for clarity. ii, Averaged, leak-subtracted (p/4 protocol) traces in each condition. The average RBC leak conductance for the six RBC-AII pairs examined in this experiment was 233 ± 40 pS, corresponding to an average input resistance of 4.7 ± 0.6 GΩ. The average series resistance for these RBCs was 29 ± 3 MΩ. Inset, The average inhibitory current, derived by subtracting the RBC membrane current in Pic.+TPMPA (blue trace) from the control (red trace). Calibration: 20 pA, 20 msec. iii, Averaged EPSCs in each condition (Vm = -90 mV). Inset, The inhibitory current from ii is inverted and scaled to the average EPSC. Calibration: 20 msec. C1, Responses from an RBC-AII pair in the presence of 100 μm picrotoxin. i, Averaged, leak-subtracted presynaptic current. ii, Single EPSC recorded in a postsynaptic AII (Vm = -90 mV). iii, Average of five EPSCs. C2, As in C1 but with CTZ (50 μm; black trace) added. Gray traces are the same as in C1, duplicated for comparison. C3, As in C2 but with TPMPA (50 μm; blue trace) added.
Figure 6.
Figure 6.
Endogenous Ca2+ buffering reduces asynchronous release. A, Presynaptic currents, a single EPSC, and an averaged EPSC recorded in an RBC-AII pair with 0.2 mm EGTA in the presynaptic pipette. The AII Vm = -60 mV. B, As in A but with 10 mm EGTA in the presynaptic pipette. The AII Vm = -60 mV. C, As in A but with 1.5 mm BAPTA in the presynaptic pipette. The AII Vm = -90 mV, and the presynaptic current trace is truncated because the steps for P/4 leak subtraction are blanked out. D, As in A but with a perforated patch (Amphotericin B) recording from the RBC. The AII Vm = -60 mV, and, again, the presynaptic P/4 responses are blanked. E, Summary comparison of asynchronous release in 0.2 mm EGTA (n = 22), 10 mm EGTA (n = 5), 1.5 mm BAPTA (n = 24), and perforated patch (n = 10). The postsynaptic current was integrated in 100 msec bins beginning 10 msec after the presynaptic voltage step, and the integral of each bin was normalized to that of the EPSC coinciding with the voltage step.
Figure 2.
Figure 2.
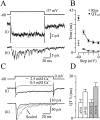
EPSCs recorded in A17s are transient. A, Left, DIC image showing characteristic morphology of an A17 amacrine cell soma. Right, Fluorescence image of an A17 amacrine cell, visualized by including Alexa 488 in the recording pipette. Scale bars: A, B, 10 μm. B, Responses from an RBC-A17 pair elicited by a 100 msec voltage step to 0 mV in the RBC. Picrotoxin and TPMPA were present in all solutions. i, Averaged, leak-subtracted presynaptic current. ii, Three consecutive, individual EPSCs recorded in the postsynaptic A17 (Vm = -60 mV). iii, Average of five EPSCs. C, Effects of CTZ on RBC-A17 synapses. i, Averaged, leak-subtracted presynaptic currents in control conditions (black trace) and in the presence of 50 μm CTX (gray trace). ii, Averaged EPSCs (Vm = -90 mV) in control conditions (black trace) and in the presence of CTZ (gray trace). Recordings are from a different pair than illustrated in B.
Figure 3.
Figure 3.
Presynaptic and postsynaptic characterization of the RBC-AII synapse. A, EPSCs (evoked by 100 msec steps from -60 to 0 mV in the RBC) recorded at -80 and +40 mV with spermine (150 μm) in the pipette are inwardly rectifying and blocked by GYKI-52466 (gray traces). B, Current-voltage relationships for EPSCs in control conditions (•; n = 6) and with spermine in the postsynaptic pipette (○; n = 10). EPSC amplitudes were normalized to that recorded at -60 mV; the line reflects a linear fit to the control data. C, i, Presynaptic currents recorded with the standard Cs+-based internal solution and elicited by voltage steps of increasing amplitude (-50 to +30 mV in 20 mV increments) from -60 mV. ii, EPSCs recorded in a synaptically coupled AII (Vm = -60 mV). Different colors correspond to various presynaptic step potentials, as illustrated at the top of the panel. D1, Ca2+ currents recorded with an NMDG+-based pipette solution. Currents were obtained by subtracting responses recorded in 100 μm Cd2+ from those in control. The color scheme is the same as in C. D2, Current-voltage relationship for the presynaptic Ca2+ current (○; recorded with NMDG+ or TMA+ internal solution; n = 5) and EPSCs evoked by the varying presynaptic voltage steps (•; recorded in different experiments with Cs+ in the presynaptic internal solution; n = 10). The EPSCs and Ca2+ currents are normalized to their respective maximum peak amplitudes. E, Contribution of T-type Ca2+ channels to release. i, Presynaptic currents evoked by steps to -35 mV from Vm = -100 mV (gray) or -50 mV (black). ii, EPSCs elicited by the same steps in an AII (Vm = -90 mV). F, A comparison of the waveforms of Ca2+ currents evoked by the voltage steps in E. i, Waveforms scaled to the same peak amplitude to illustrate contrasting inactivation. ii, Scaled waveforms on an expanded time scale to illustrate contrasting activation. G, Peak and integral of Ca2+ currents and EPSCs elicited by steps from -100 mV normalized to those elicited by steps from -50 mV to illustrate that the large, inactivating Ca2+ current enhances glutamate release from the presynaptic terminal (n = 7).
Figure 4.
Figure 4.
Release rate varies with Ca2+ influx. A, i, Presynaptic current elicited by a presynaptic 100 msec voltage step from -60 to -37 mV. ii, Averaged EPSC recorded in a synaptically coupled AII (Vm = -90 mV). B, Average 10-90% rise times (○) and QT1/2 (•) of EPSCs evoked by stepping the RBC to approximately -40 mV or to potentials between -30 and 0 mV (the data in the -40 mV point comes from separate RBC-AII pairs, as indicated by the fact that it is not joined to the other points, but n = 9 for both sets of data). C, i, Presynaptic currents elicited in control (black) or low [Ca2+] (gray) conditions. ii, EPSCs evoked in a synaptically coupled AII (Vm = -60 mV). The EPSC in low [Ca2+] is scaled to control for comparison. The RBC membrane current is outward in 0.5 mm Ca2+ because a small Ca2+ current is contaminated by an outward conductance. D, Summary QT1/2 values for EPSCs elicited by presynaptic steps to -30 and 0 mV (white bars; n = 9) and in normal and low Ca2+ (gray bars; n = 9).
Figure 5.
Figure 5.
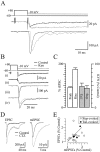
Rapid presynaptic Ca2+ entry evokes fast tEPSCs. A, i, Presynaptic currents elicited by a step from +90 to -60 mV (black trace) or from -60 to -10 mV (gray trace). ii, EPSCs (Vm = -90 mV) recorded in a synaptically coupled AII. Note that the presynaptic step from -60 to +90 mV elicits no postsynaptic response. B, Effects of 250 μm KYN (gray traces) on the presynaptic tail current (i), the presynaptic step-evoked current (ii), tEPSC (iii), and step-evoked EPSC (iv). Responses are from the same RBC-AII pair as in A. C, Summary comparison of amplitude and rise time of step-evoked EPSCs normalized to those of the tEPSC recorded in the same cell (open bars; n = 29). Summary effects of KYN (as a percentage of control) on the amplitudes of step-evoked EPSCs and tEPSCs (n = 5). D, Average EPSCs or mEPSCs recorded in an AII (Vm = -90 mV) in the absence (black) or presence (gray) of CTZ (50 μm). E, Summary comparison of the effect of CTZ (as a percentage of control) on EPSC and mEPSC amplitude. Data from 20 recorded pairs are shown (n = 16 for step-evoked EPSCs; n = 4 for tEPSCs). Diagonal line indicates unity.
Figure 7.
Figure 7.
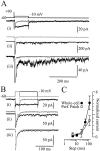
Time course of asynchronous release. A, Ca2+ currents (i) (tail = gray, step = black) and EPSCs (single responses in ii, offset for clarity; averages of 7 responses in iii) evoked with 0.2 mm EGTA in the presynaptic pipette. The peak of the average EPSCs in iii is truncated to magnify the asynchronous portion of the postsynaptic current. Asynchronous release is not evident in tEPSCs (gray traces). B, Voltage steps of 25 msec (to -10 mV) do not evoke asynchronous release [gray traces: presynaptic current (i), single postsynaptic responses (ii), and average of 7 responses (iii)], but 125 msec voltage steps do (black traces). C, The relationship between the length of the presynaptic depolarization and asynchronous release when the presynaptic RBC was recorded in either the whole-cell (•; n = 7 RBC-AII pairs) or the perforated-patch configuration (○; n = 6 RBC-AII pairs) with 0.2 mm EGTA in the pipette solution. The postsynaptic current was integrated over a 1 sec interval beginning 25 msec after the presynaptic voltage step and normalized to the integral of the EPSC evoked by a 5 msec step.
Figure 8.
Figure 8.
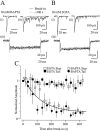
Transmission from RBC terminals is blocked rapidly by 10 mm BAPTA but not by 10 mm EGTA. A, Recordings with 10 mm BAPTA; responses were elicited by alternating tail currents and voltage steps from -60 to -10 mV in the RBC at 17 sec intervals. i, The first tEPSC (black), evoked within 15 sec of establishing a whole-cell presynaptic recording (time = 0), is compared with one evoked 323 sec later (gray). ii, Step-evoked EPSCs at time = 17 sec (black) or 340 sec (gray). iii, Presynaptic currents (averages of 3 sequential responses) from t = 17-85 sec (black) or 272-340 sec (gray) show that 10 mm BAPTA does not affect Ca2+ influx into the presynaptic terminal. B, Recordings with 10 mm EGTA: i, ii, iii as in A. C, Summary of the effects of 10 mm BAPTA (n = 5) or 10 mm EGTA (n = 5) on EPSC amplitude. The peak amplitudes of individual responses from each cell were normalized to the peak amplitude of the first tEPSC recorded in that cell. The line is an exponential fit to the pooled (step- and tail-evoked) BAPTA data points; τ = 125 sec.

References

    1. Barrett EF, Stevens CF ( 1972) The kinetics of transmitter release at the frog neuromuscular junction. J Physiol (Lond) 227: 691-708. - PMC - PubMed
    1. Berntson A, Taylor WR ( 2000) Response characteristics and receptive field widths of on-bipolar cells in the mouse retina. J Physiol (Lond) 524: 879-889. - PMC - PubMed
    1. Beutner D, Voets T, Neher E, Moser T ( 2001) Calcium dependence of exocytosis and endocytosis at the cochlear inner hair cell afferent synapse. Neuron 29: 681-690. - PubMed
    1. Bloomfield SA, Dacheux RF ( 2001) Rod vision: pathways and processing in the mammalian retina. Prog Retin Eye Res 20: 351-384. - PubMed
    1. Bloomfield SA, Xin D ( 2000) Surround inhibition of mammalian AII amacrine cells is generated in the proximal retina. J Physiol (Lond) 523: 771-783. - PMC - PubMed

Publication types

MeSH terms

LinkOut - more resources