. 2003 Dec;23(24):9349-60.
doi: 10.1128/MCB.23.24.9349-9360.2003.

Deletion of alpha4 integrins from adult hematopoietic cells reveals roles in homeostasis, regeneration, and homing

Affiliations

Deletion of alpha4 integrins from adult hematopoietic cells reveals roles in homeostasis, regeneration, and homing

Linda M Scott et al. Mol Cell Biol. 2003 Dec.

Abstract

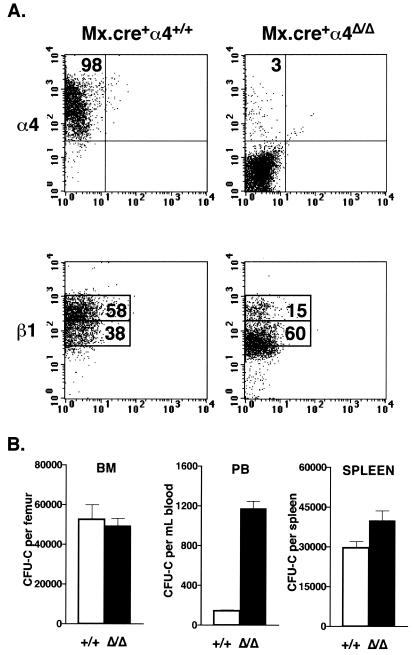
We have explored the functional implications of inducible alpha4 integrin deletion during adult hematopoiesis by generating a conditional-knockout mouse model, and we show that alpha4 integrin-deficient hematopoietic progenitor cells accumulate in the peripheral blood soon after interferon-induced gene deletion. Although their numbers gradually stabilize at a lower level, progenitor cell influx into the circulation continues at above-normal levels for more than 50 weeks. Concomitantly, a progressive accumulation of progenitors occurs within the spleen. In addition, the regeneration of erythroid and myeloid progenitor cells is delayed during stress hematopoiesis induced by phenylhydrazine or by 5-fluorouracil, suggesting impairment in early progenitor expansion in the absence of alpha4 integrin. Moreover, in transplantation studies, homing of alpha4(-/-) cells to the bone marrow, but not to the spleen, is selectively impaired, and short-term engraftment is critically delayed in the early weeks after transplantation. Thus, conditional deletion of alpha4 integrin in adult mice is accompanied by a novel hematopoietic phenotype during both homeostasis and recovery from stress, a phenotype that is distinct from the ones previously described in alpha4 integrin-null chimeras and beta1 integrin-conditional knockouts.


Figures

FIG. 1.
FIG. 1.
Targeting of the murine α4 locus. (A) Maps of the targeting construct containing three loxP elements (grey bars) and positive (NEO) and negative (DT-A) selection cassettes; the α4 locus (α4+) including the first two exons (black boxes); the locus after homologous recombination (α4flox) and after Cre-mediated excision (α4Δ). Sites for restriction enzymes HindIII (H), KpnI (K), SphI (S), and XbaI are shown; sites introduced after homologous recombination are in bold typeface. The XbaI restriction fragments that are diagnostic for each of the three alleles are shown. (B) Homologous recombination and Cre-mediated excision at the α4 locus. The α4+ allele in ES cells migrates as a 12-kb SphI (lane 1) or 7.1-kb XbaI (lane 3) fragment, and the α4flox allele migrates as a 5.5-kb SphI (lane 2) or 5.7-kb XbaI (lane 4) fragment. BM cells from α4flox/flox mice were transduced with retroviruses encoding Cre and/or GFP, sorted, and cultured in methylcellulose. XbaI-digested DNAs from MSCViresGFP-transduced α4+/+ colonies (lane 5) are compared to those from CFU-C transduced by MSCViresGFP (lane 6) or MSCV-cre-iresGFP (lane 7). The location of the probe used is indicated by the hatched bar in panel A. (C) BM cells from α4+/+, α4flox/+, and α4flox/flox littermates were stained with PE-conjugated anti-α4 integrin antibody (PS/2) and analyzed by FACS (black histograms). An isotype control FACS profile (dotted line) is included for comparison. Typical FACS profiles for each group of animals are shown.
FIG. 2.
FIG. 2.
Deletion of α4 integrin expression in the BM alters progenitor distribution. (A) Mx.cre+α4+/+ and Mx.cre α4flox/flox animals were injected with poly(I)poly(C), and their BM nucleated cells were examined by FACS 2 weeks later for α4 and β1 integrin expression levels. Typical FACS profiles for both groups of animals are shown. (B) Progenitor cell numbers in the BM (n = 16 per genotype), PB (n = 45 per genotype), and spleen (n = 10 per genotype) of Mx.cre+α4+/+and Mx.cre+α4Δ/Δ mice were assessed 2 weeks after deletion by using CFU-C assays. White bars, Mx.cre+α4+/+ mice; black bars, Mx.cre+α4Δ/Δ mice.
FIG. 3.
FIG. 3.
α4 integrin-null progenitor numbers in the PB, BM, and spleen over time. (A) PB progenitor levels in Mx.cre+α4+/+ and Mx.cre+α4Δ/Δ mice (n = 4 per genotype) were monitored over time. The animals were euthanized 28 weeks after induced deletion, and the progenitor contents of the BM and spleen were assessed in CFU-C assays. White bars, Mx.cre+α4+/+ mice; black bars, Mx.cre+α4Δ/Δ mice. (B) PB progenitor levels of nonsplenectomized and splenectomized Mx.cre+α4Δ/Δ mice (n = 4 per group) were monitored over time. Black bars, nonsplenectomized Mx.cre+α4Δ/Δ mice; striped bars, splenectomized Mx.cre+α4Δ/Δ mice. (C) The BM progenitor content of splenectomized Mx.cre+α4+/+ and Mx.cre+α4Δ/Δ mice (n = 4 per genotype) was assessed 50 weeks after induced deletion. White bar, splenectomized Mx.cre+α4+/+ mice; striped bar, splenectomized Mx.cre+α4Δ/Δ mice.
FIG. 4.
FIG. 4.
Response to PHZ-induced anemia in the absence of α4 integrin. Responses to hemolytic anemia were tested in Mx.cre+α4+/+ and Mx.cre+α4Δ/Δ mice (n = 4 per genotype) by PB differential analyses performed 2, 4, 6, 8, and 10 days after PHZ treatment. (A) Reduced reticulocyte levels were observed in the PB of the deletion-induced mice 4 to 6 days after PHZ administration. The α4 integrin-deficient platelet levels also failed to increase above baseline levels in response to PHZ from days 2 to 6. *, significant difference. White bars, Mx.cre+α4+/+ mice; black bars, Mx.cre+α4Δ/Δ mice. (B) Erythroid progenitor numbers in BM and spleen were evaluated 2 days after the last PHZ treatment by using plasma clot assays. BFU-e numbers were significantly reduced in the BM and spleen of deletion-induced animals. In contrast, CFU-e levels were reduced in the BM but not in the spleen.
FIG. 5.
FIG. 5.
Response to cytotoxic stress induced by 5FU in the absence of α4 integrin. Individual groups of Mx.cre+α4+/+ and Mx.cre+α4Δ/Δ mice (n = 4 per genotype) were treated with 5FU, and analyzed 4, 8, 12, or 16 days later to determine the level of myeloid recovery in the BM and PB (nucleated cells and progenitor cells). White bars, Mx.cre+α4+/+mice; black bars, Mx.cre+α4Δ/Δ mice.
FIG. 6.
FIG. 6.
α4 integrin-deficient progenitors have reduced BM homing. BM cells from Mx.cre+α4+/+ or Mx.cre+α4Δ/Δ mice were injected without prior treatment (A) or after incubation with an anti-LFA-1 antibody (B) into irradiated recipient mice (n = 5 recipients per donor genotype). These animals were euthanized 24 h later, and the progenitor content of the BM, PB, and spleen was assessed by CFU-C assays.
FIG. 7.
FIG. 7.
Short-term engraftment of α4-deficient cells in recipients with and without spleens. A total of 0.5 × 10⁶ BM cells from Mx.cre+α4+/+or from Mx.cre+α4Δ/Δ animals was injected into irradiated spleen-containing recipients (A), or 106 α4+/+ or +α4Δ/Δ cells were injected into irradiated splenectomized recipients (B); progenitor content (as determined by CFU-C assays) in BM, PB, and spleen was analyzed 2 weeks later (n = 5 mice per donor genotype).

References

    1. Abkowitz, J. L., A. E. Robinson, S. Kale, M. W. Long, and J. Chen. 2003. The mobilization of hematopoietic stem cells during homeostasis and after cytokine exposure. Blood 102:1249-1253. - PubMed
    1. Arroyo, A., J. T. Yang, H. Rayburn, and R. O. Hynes. 1996. Differential requirements for α4 integrins during fetal and adult hematopoiesis. Cell 85:997-1008. - PubMed
    1. Arroyo, A. G., J. T. Yang, H. Rayburn, and R. O. Hynes. 1999. α4 integrins regulate the proliferation/differentiation balance of multilineage hematopoietic progenitors in vivo. Immunity 11:555-566. - PubMed
    1. Arroyo, A. G., D. Taverna, C. A. Whittaker, U. G. Strauch, B. L. Bader, H. Rayburn, D. Crowley, C. M. Parker, and R. O. Hynes. 2000. In vivo roles of integrins during leukocyte development and traffic: insights from the analysis of mice chimeric for α5, αv, and α4 integrins. J. Immunol. 165:4667-4675. - PubMed
    1. Boggs, D. R. 1984. The total marrow mass of the mouse: a simplified method of measurement. Am. J. Hematol. 16:277-286. - PubMed

Publication types

MeSH terms