

Validation of cDNA microarray gene expression data obtained from linearly amplified RNA
- PMID: 14645691
- PMCID: PMC1187346
- DOI: 10.1136/mp.56.6.307
Validation of cDNA microarray gene expression data obtained from linearly amplified RNA
Abstract
Background: DNA microarray technology has permitted the analysis of global gene expression profiles for several diseases, including cancer. However, standard hybridisation and detection protocols require micrograms of mRNA for microarray analysis, limiting broader application of this technology to small excisional biopsies, needle biopsies, and/or microdissected tissue samples. Therefore, linear amplification protocols to increase the amount of RNA have been developed. The correlation between the results of microarray experiments derived from non-amplified RNA and amplified samples needs to be evaluated in detail.
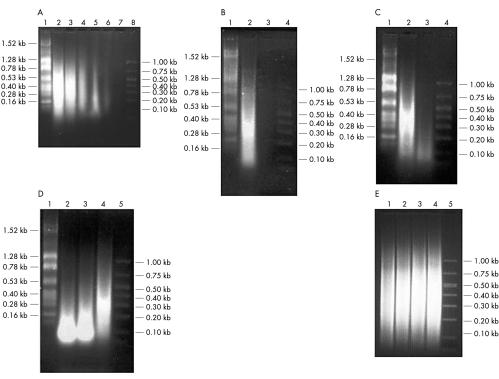
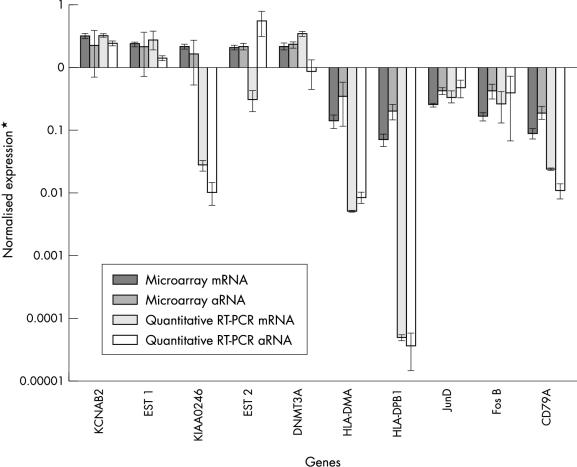
Methods: Total RNA was amplified and replicate hybridisation experiments were performed with linearly amplified (aRNA) and non-amplified mRNA from tonsillar B cells and the SUDHL-6 cell line using cDNA microarrays containing approximately 4500 genes. The results of microarray differential expression using either source of RNA (mRNA or aRNA) were also compared with those found using real time quantitative reverse transcription polymerase chain reaction (QRT-PCR).
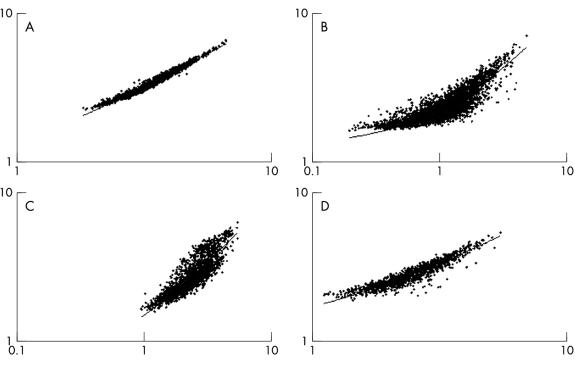
Results: Microarray experiments using aRNA generated reproducible data displaying only small differences to data obtained from non-amplified mRNA. The quality of the starting total RNA template and the concentration of the promoter primer used to synthesise cDNA were crucial components of the linear amplification reaction. Approximately 80% of selected upregulated and downregulated genes identified by microarray analysis using linearly amplified RNA were confirmed by QRT-PCR using non-amplified mRNA as the starting template.
Conclusions: Linear RNA amplification methods can be used to generate high fidelity microarray expression data of comparable quality to data generated by microarray methods that use non-amplified mRNA samples.
Figures
Similar articles
-
Oligonucleotide microarray analysis of aminoallyl-labeled cDNA targets from linear RNA amplification.Biotechniques. 2004 Oct;37(4):580, 582-6, 588. doi: 10.2144/04374ST02. Biotechniques. 2004. PMID: 15517970
-
An evaluation of linear RNA amplification in cDNA microarray gene expression analysis.Mol Genet Metab. 2006 Jan;87(1):71-9. doi: 10.1016/j.ymgme.2005.08.007. Epub 2005 Oct 7. Mol Genet Metab. 2006. PMID: 16214384
-
Use of RNA amplification in the optimal characterization of global gene expression using cDNA microarrays.J Cell Physiol. 2004 Dec;201(3):359-65. doi: 10.1002/jcp.20074. J Cell Physiol. 2004. PMID: 15389558
-
[Strategy for the identification of amplified genes in tumors].Zhonghua Yi Xue Yi Chuan Xue Za Zhi. 2004 Oct;21(5):474-8. Zhonghua Yi Xue Yi Chuan Xue Za Zhi. 2004. PMID: 15476174 Review. Chinese.
-
Strategies for microarray analysis of limiting amounts of RNA.Brief Funct Genomic Proteomic. 2003 Apr;2(1):31-6. doi: 10.1093/bfgp/2.1.31. Brief Funct Genomic Proteomic. 2003. PMID: 15239941 Review.
Cited by
-
Melatonin treatment in old mice enables a more youthful response to LPS in the brain.J Neuroimmunol. 2007 Jan;182(1-2):22-31. doi: 10.1016/j.jneuroim.2006.09.005. Epub 2006 Oct 30. J Neuroimmunol. 2007. PMID: 17070935 Free PMC article.
-
Evaluation of sense-strand mRNA amplification by comparative quantitative PCR.BMC Genomics. 2004 Oct 6;5:76. doi: 10.1186/1471-2164-5-76. BMC Genomics. 2004. PMID: 15469607 Free PMC article.
-
Linking plant nutritional status to plant-microbe interactions.PLoS One. 2013 Jul 16;8(7):e68555. doi: 10.1371/journal.pone.0068555. Print 2013. PLoS One. 2013. PMID: 23874669 Free PMC article.
-
Early pregnancy peripheral blood gene expression and risk of preterm delivery: a nested case control study.BMC Pregnancy Childbirth. 2009 Dec 10;9:56. doi: 10.1186/1471-2393-9-56. BMC Pregnancy Childbirth. 2009. PMID: 20003277 Free PMC article.
-
Global gene expression profiles reveal significant nuclear reprogramming by the blastocyst stage after cloning.Proc Natl Acad Sci U S A. 2005 Dec 6;102(49):17582-7. doi: 10.1073/pnas.0508952102. Epub 2005 Nov 28. Proc Natl Acad Sci U S A. 2005. PMID: 16314565 Free PMC article.
References
-
- Schena M, Shalon D, Davis RW, et al. Quantitative monitoring of gene expression patterns with a complementary DNA microarray. Science 1995;270:467–70. - PubMed
-
- DeRisi J, Penland L, Brown PO, et al. Use of a cDNA microarray to analyse gene expression patterns in human cancer. Nat Genet 1996;14:457–60. - PubMed
-
- Ross DT, Scherf U, Eisen MB, et al. Systematic variation in gene expression patterns in human cancer cell lines. Nat Genet 2000;24:227–35. - PubMed
Publication types
MeSH terms
Substances
Grants and funding
LinkOut - more resources
Full Text Sources
Other Literature Sources