Inorganic carbon limitation induces transcripts encoding components of the CO(2)-concentrating mechanism in Synechococcus sp. PCC7942 through a redox-independent pathway
- PMID: 14645730
- PMCID: PMC300758
- DOI: 10.1104/pp.103.029728
Inorganic carbon limitation induces transcripts encoding components of the CO(2)-concentrating mechanism in Synechococcus sp. PCC7942 through a redox-independent pathway
Abstract
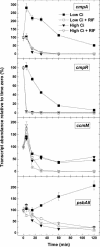
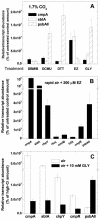
The cyanobacterial CO2-concentrating mechanism (CCM) allows photosynthesis to proceed in CO2-limited aquatic environments, and its activity is modulated in response to inorganic carbon (Ci) availability. Real-time reverse transcriptase-PCR analysis was used to examine the transcriptional regulation of more than 30 CCM-related genes in Synechococcus sp. strain PCC7942 with an emphasis on genes encoding high-affinity Ci transporters and carboxysome-associated proteins. This approach was also used to test hypotheses about sensing of Ci limitation in cyanobacteria. The transcriptional response of Synechococcus sp. to severe Ci limitation occurs rapidly, being maximal within 30 to 60 min, and three distinct temporal responses were detected: (a). a rapid, transient induction for genes encoding carboxysome-associated proteins (ccmKLMNO, rbcLS, and icfA) and the transcriptional regulator, cmpR; (b). a slow sustained induction of psbAII; and (c). a rapid sustained induction of genes encoding the inducible Ci transporters cmpABCD, sbtA, and ndhF3-D3-chpY. The Ci-responsive transcripts investigated had half-lives of 15 min or less and were equally stable at high and low Ci. Through the use of a range of physiological conditions (light and Ci levels) and inhibitors such as 3-(3,4-dichlorophenyl)-1,1dimethylurea, glycolaldehyde, dithiothreitol, and ethoxyzolamide, we found that no strict correlation exists between expression of genes known to be induced under redox stress, such as psbAII, and the expression of the Ci-responsive CCM genes. We argue that redox stress, such as that which occurs under high-light stress, is unlikely to be a primary signal for sensing of Ci limitation in cyanobacteria. We discuss the data in relation to current theories of CO2 sensing in cyanobacteria.
Figures


Similar articles
-
Inorganic carbon limitation and light control the expression of transcripts related to the CO2-concentrating mechanism in the cyanobacterium Synechocystis sp. strain PCC6803.Plant Physiol. 2003 May;132(1):218-29. doi: 10.1104/pp.019349. Plant Physiol. 2003. PMID: 12746527 Free PMC article.
-
Sensing of inorganic carbon limitation in Synechococcus PCC7942 is correlated with the size of the internal inorganic carbon pool and involves oxygen.Plant Physiol. 2005 Dec;139(4):1959-69. doi: 10.1104/pp.105.069146. Epub 2005 Nov 23. Plant Physiol. 2005. PMID: 16306144 Free PMC article.
-
Roles of CmpR, a LysR family transcriptional regulator, in acclimation of the cyanobacterium Synechococcus sp. strain PCC 7942 to low-CO(2) and high-light conditions.Mol Microbiol. 2004 May;52(3):837-45. doi: 10.1111/j.1365-2958.2004.04021.x. Mol Microbiol. 2004. PMID: 15101988
-
Advances in understanding the cyanobacterial CO2-concentrating-mechanism (CCM): functional components, Ci transporters, diversity, genetic regulation and prospects for engineering into plants.J Exp Bot. 2008;59(7):1441-61. doi: 10.1093/jxb/erm112. Epub 2007 Jun 19. J Exp Bot. 2008. PMID: 17578868 Review.
-
Inorganic carbon transporters of the cyanobacterial CO2 concentrating mechanism.Photosynth Res. 2011 Sep;109(1-3):47-57. doi: 10.1007/s11120-010-9608-y. Epub 2011 Feb 26. Photosynth Res. 2011. PMID: 21359551 Review.
Cited by
-
Selection of suitable reference genes for RT-qPCR analyses in cyanobacteria.PLoS One. 2012;7(4):e34983. doi: 10.1371/journal.pone.0034983. Epub 2012 Apr 4. PLoS One. 2012. PMID: 22496882 Free PMC article.
-
Carbon availability affects diurnally controlled processes and cell morphology of Cyanothece 51142.PLoS One. 2013;8(2):e56887. doi: 10.1371/journal.pone.0056887. Epub 2013 Feb 15. PLoS One. 2013. PMID: 23457634 Free PMC article.
-
Collaborative regulation of CO2 transport and fixation during succinate production in Escherichia coli.Sci Rep. 2015 Dec 2;5:17321. doi: 10.1038/srep17321. Sci Rep. 2015. PMID: 26626308 Free PMC article.
-
Single-Organelle Quantification Reveals Stoichiometric and Structural Variability of Carboxysomes Dependent on the Environment.Plant Cell. 2019 Jul;31(7):1648-1664. doi: 10.1105/tpc.18.00787. Epub 2019 May 2. Plant Cell. 2019. PMID: 31048338 Free PMC article.
-
Structure of Halothiobacillus neapolitanus carboxysomes by cryo-electron tomography.J Mol Biol. 2006 Dec 1;364(3):526-35. doi: 10.1016/j.jmb.2006.09.024. Epub 2006 Sep 14. J Mol Biol. 2006. PMID: 17028023 Free PMC article.
References
-
- Amoroso G, Seimetz N, Sültemeyer D (2003) The dc13 gene upstream of ictB is involved in rapid induction of the high affinity Na+-dependent HCO3- transporter in cyanobacteria. Photosynth Res 77: 127-138 - PubMed
-
- Badger MR, Palmqvist K, Yu JW (1994) Measurement of CO2 and HCO3- fluxes in cyanobacteria and microalgae during steady-state photosynthesis. Physiol Plant 90: 529-536
-
- Badger MR, Price GD (2003) CO2 concentrating mechanisms in cyanobacteria: molecular components, their diversity and evolution. J Exp Bot 54: 609-622 - PubMed
-
- Benschop JJ, Badger MR, Price GD (2003) Characterisation of CO2 and HCO3- uptake in the cyanobacterium Synechocystis sp. PCC6803. Photosynth Res 77: 117-126 - PubMed
MeSH terms
Substances
LinkOut - more resources
Full Text Sources
Other Literature Sources

