. 2004 Mar;5(1):66-79.
doi: 10.1007/s10162-003-4021-2. Epub 2003 Dec 18.

Progressive hearing loss and increased susceptibility to noise-induced hearing loss in mice carrying a Cdh23 but not a Myo7a mutation

Affiliations

Progressive hearing loss and increased susceptibility to noise-induced hearing loss in mice carrying a Cdh23 but not a Myo7a mutation

Ralph H Holme et al. J Assoc Res Otolaryngol. 2004 Mar.

Abstract

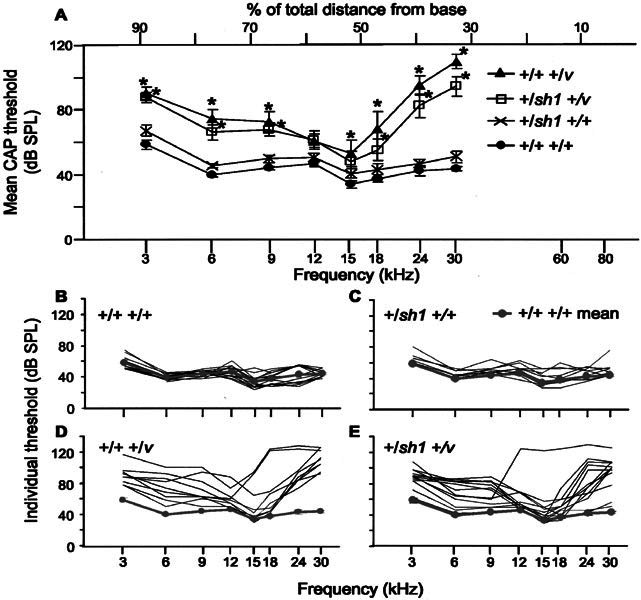
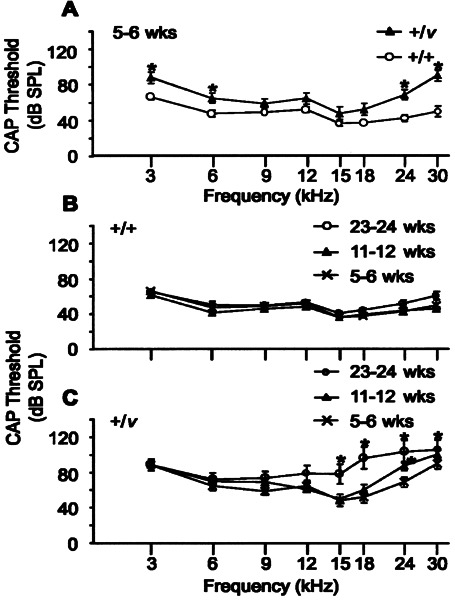
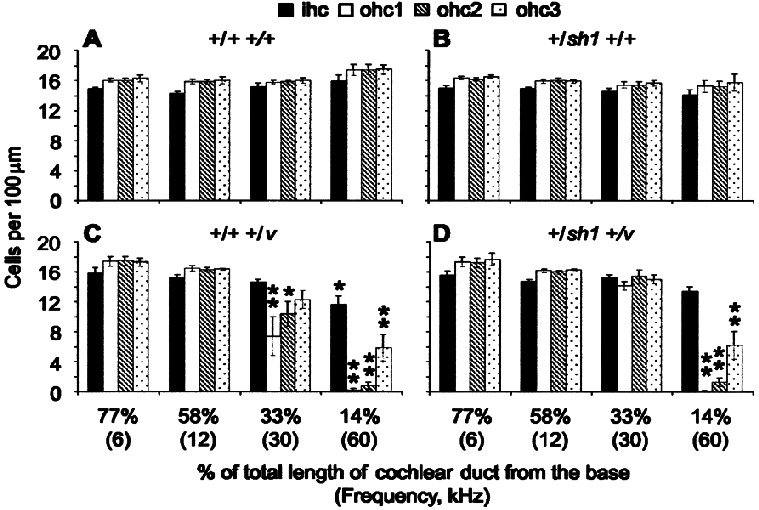
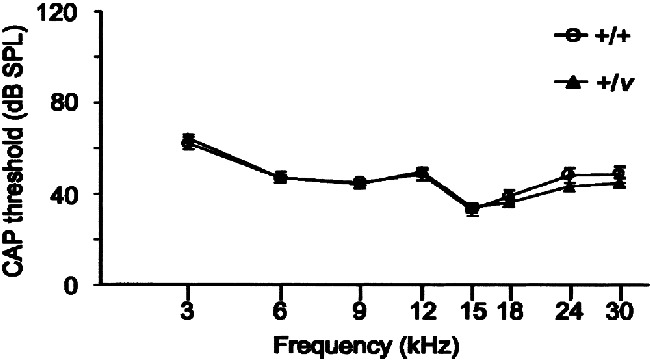
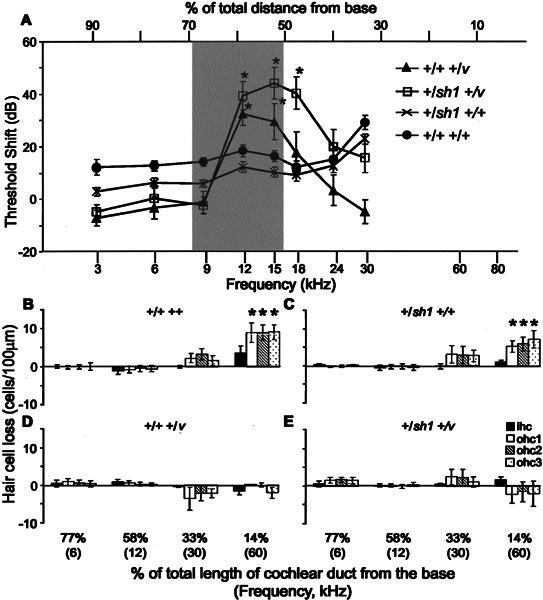
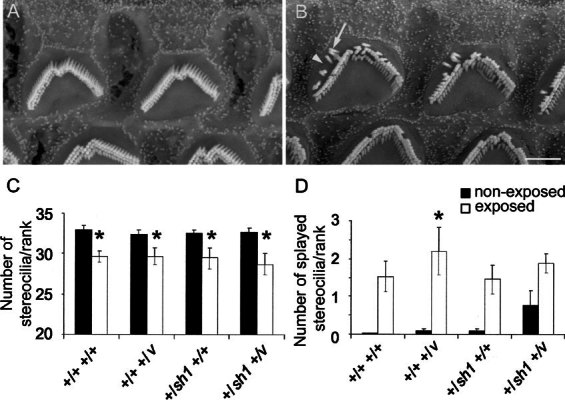
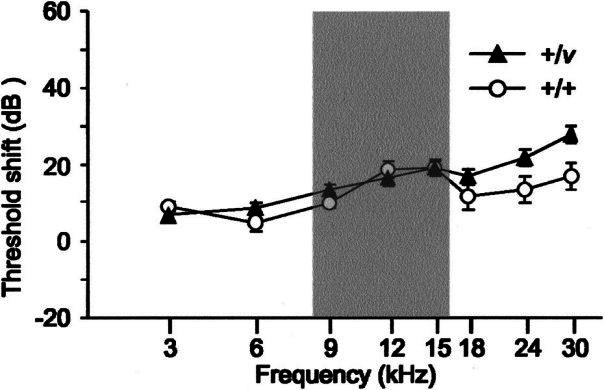
Exposure to intense noise can damage the stereocilia of sensory hair cells in the inner ear. Since stereocilia play a vital role in the transduction of sound from a mechanical stimulus into an electrical one, this pathology is thought to contribute to noise-induced hearing loss. Mice homozygous for null mutations in either the myosin VIIa ( Myo7a) or cadherin 23 ( Cdh23) genes are deaf and have disorganized stereocilia bundles. We show that mice heterozygous for a presumed null allele of Cdh23 ( Cdh23(v)) have low- and high-frequency hearing loss at 5-6 weeks of age, the high-frequency component of which worsens with increasing age. We also show that noise-induced hearing loss in 11-12-week-old Cdh23(v) heterozygotes is two times greater than for wild-type littermates. Interestingly, these effects are dependent upon the genetic background on which the Cdh23(v) mutation is carried. Noise-induced hearing loss in 11-12-week-old mice heterozygous for a null allele of Myo7a ( Myo7a(4626SB)) is not significantly different from wild-type littermates. CDH23 is the first gene known to cause deafness in the human population to be linked with predisposition to noise-induced hearing loss.


Figures

Figure 1
Figure 1
CAP thresholds for 11–12-week-old nonexposed mice. A. Mean CAP thresholds for +/+ +/+, +/sh1 +/+, +/+ +/v, and +/sh1 +/v mice plotted against frequency scaled according to the frequency place map described by Ehret (1975). * signifies frequencies at which thresholds were significantly different from those of +/+ +/+ mice (p < 0.05). Error bars represent SEM. CAP thresholds for +/+ +/v mice were significantly raised compared with +/+ +/+ mice at both low (3 kHz, +31 dB, p = 0.002; 6 kHz, +36 dB, p < 0.001; and 9 kHz, +29 dB, p = 0.004) and high frequencies (15 kHz, +19 dB, p = 0.047; 18 kHz, +30 dB, p = 0.001; 24 kHz, +53 dB, p < 0.001; and 30 kHz, +66 dB, p < 0.001). Similarly, for +/sh1 +/v mice, thresholds were significantly raised at low (3 kHz, +29 dB, p = 0.002, 6 kHz, +27 dB, p = 0.003; and 9 kHz, +24 dB, p =0.007) and high frequencies (18 kHz, +17 dB, p = 0.041; 24 kHz, +40 dB, p < 0.001; and 30 kHz, +51 dB, p < 0.001) compared with +/+ +/+ mice. B–E. CAP thresholds for individual +/+ +/+ (B), +/sh1 +/+ (C), +/+ +/v (D), and +/sh1 +/v (E) mice. For reference, the mean CAP threshold for +/+ +/+ mice has been plotted in grey. Mice heterozygous for Cdh23v show greater interanimal variability than mice wild type at this locus.
Figure 2
Figure 2
Effect of age on CAP thresholds for nonexposed mice. Data for +/+ +/v and +/sh1 +/v mice were merged and designated +/v, and data for +/sh1 +/+ and +/+ +/+ mice merged and designated +/+. A. Mean CAP thresholds for +/v and +/+ mice aged between 5 and 6 weeks. * signifies frequencies at which thresholds for +/v mice were significantly greater than those of +/+ mice (p < 0.05). Error bars represent SEM. CAP thresholds were significantly raised at 3 kHz (+22 dB, p = 0.0103), 6 kHz (+17 dB, p = 0.0284), 24 kHz (+26 dB, p = 0.001), and 30 kHz (+40 dB, p < 0.0001) in +/v compared with +/+ mice. B, C. Mean CAP thresholds for +/+ (B) and +/v (C) mice aged either 5–6 weeks, 11–12 weeks, or 23–24 weeks of age. * signifies frequencies at which thresholds were significantly greater than those of 5–6-week-old mice (p < 0.05). Error bars represent SEM. CAP thresholds for +/+ mice did not change with age. In contrast, CAP thresholds in 23–24-week-old +/v mice were significantly greater than those of 5–6-week-old +/v mice at 15 kHz (+30 dB, p = 0.0002), 18 kHz (+44 dB, p < 0.0001), 24 kHz (+34 dB, p < 0.0001), and 30 kHz (+16 dB, p = 0.0491) demonstrating that the high-frequency hearing loss worsens with increasing age. No significant increase in thresholds was observed at the low frequencies (3 kHz, p = 0.943 and 6 kHz, p = 0.3677) between 5–6- and 23–24-week-old +/v mice.
Figure 3
Figure 3
Hair cell counts for nonexposed mice. Histograms showing the mean number of IHCs and OHCs in rows 1, 2, and 3 per 100 µm. OHC row 1 is defined as the row nearest the IHCs and 3 the furthest. Counts were made for +/+ +/+ (A), +/sh1 +/+ (B), +/+ +/v (C), and +/sh1 +/v (D) mice at 14%, 33%, 58%, and 77% of the total length of the cochlear duct from the base. The frequencies that each of these locations responds best to are shown in brackets. * signifies a significant reduction in cell number compared with the number of cells in +/+ +/+ mice (*p < 0.05, **p < 0.001). Error bars represent SEM. ihc: inner hair cell; ohc1: outer hair cell in row 1; ohc2: outer hair cell in row 2; ohc3: outer hair cell in row 3.
Figure 4
Figure 4
Effect of genetic background on CAP thresholds of 11–12-week-old nonexposed mice. Mean CAP thresholds for +/+ and +/v mice with no genetic contribution from the sh1 background. At all frequencies tested there were no significant differences in CAP thresholds between +/+ and +/v mice (p > 0.05). Error bars represent SEM.
Figure 5
Figure 5
Effect of noise exposure on CAP thresholds and hair cell numbers. A. Mean threshold shift a week after exposure to 8–16 kHz delivered at 103 dB SPL for 2 h for 11–12-week-old +/+ +/+, +/sh1 +/+, +/+ +/v, and +/sh1+/v mice. Threshold shifts were calculated by subtracting the mean threshold for exposed mice from that of nonexposed mice with the same genotype. They are plotted against frequency scaled according to the frequency place map described by Ehret (1975). Frequencies at which threshold shifts differ significantly (p < 0.05) from those of +/+ +/+ mice are signified by *. The shaded box marks the frequency of noise used to expose these mice. Error bars represent SEM. B–E. Histograms showing the mean loss of IHCs and OHCs a week after noise exposure for 11–12-week-old +/+ +/+ (B),+/sh1 +/+ (C), +/+ +/v (D), and +/sh1 +/v (E) mice. Hair cell loss was measured at 14%, 33%, 58%, and 77% of the total length of the cochlear duct from the base. The frequencies that each of these locations responds best to are shown in brackets. Hair cell loss was calculated by subtracting the mean number of cells in exposed mice from the mean number of cells in nonexposed control mice. * denotes a significant (p ≤ 0.01) increase in hair cell loss. Note that there was no significant loss of hair cells at the 58% (12 kHz) region of either +/+ +/v or +/sh1 +/v mice despite a large threshold shift (approximately 35 dB) at this frequency. Error bars represent SEM. ihc: inner hair cell; ohc1: outer hair cell in row 1, nearest the IHCs; ohc2: outer hair cell in row 2; ohc3: outer hair cell in row 3, furthest from the IHCs.
Figure 6
Figure 6
Effect of noise exposure on hair cell stereocilia. A, B. Scanning electron micrographs of the surface of OHCs, in the outermost row (row 3), 58% of the total length of the cochlear duct from the base. This region responds best to 12 kHz according to the frequency place map described by Ehret (1975). A. Nonexposed +/sh1 +/v mouse, 11–12 weeks of age. Stereocilia are upright and arranged in a tight V-shaped bundle. B. +/sh1+/v mouse, 11–12 weeks of age, a week after being exposed to 8–16 kHz delivered at 103 dB SPL for 2 h. Gaps within the ranks of stereocilia are present (arrowhead) as are splayed stereocilia that lean outward from the bundle (arrow). Scale bar = 2 µm. C, D. Histograms showing the mean number of stereocilia (C) and splayed stereocilia (D) in the outermost (tallest) rank. Only OHCs positioned in the row nearest the IHCs and 58% of the total length of the cochlear duct from the base were analyzed. Counts were made for nonexposed (black bars) and noise-exposed (white bars) +/+ +/+, +/+ +/v, +/sh1 +/+, and +/sh1 +/v mice a week after exposure. * indicates a significant difference (p < 0.05) between exposed and nonexposed mice. At the genotype level, only +/+ +/v mice had a significant increase in splayed stereocilia after noise exposure. However, the effect of noise on stereocilia splaying was highly significant for the group as a whole (p < 0.0001 using a log–linear model). Neither the amount of stereocilia loss nor the increase in number of splayed stereocilia differed significantly between genotypes (p > 0.1). Error bars represent the SEM.
Figure 7
Figure 7
Effect of genetic background on CAP threshold shifts. Graph shows the mean shift in CAP threshold a week after exposure to 8–16 kHz delivered at 103 dB SPL for 2 h for 11–12-week-old +/+ and +/v mice with no genetic contribution from the sh1 background. Threshold shifts were calculated by subtracting the mean threshold for exposed mice from those of nonexposed mice. For +/+ mice, threshold shifts were significant at 12 kHz (+18 dB, p = 0.008), 15 kHz (+19 dB, p = 0.006), and 30 kHz (+17 dB, p = 0.016) but not at 3, 6, 9, 18, or 24 kHz. Similarly, for +/v mice threshold shifts were significant at 9 kHz (+13 dB, p = 0.012), 12 kHz (+16 dB, p = 0.002), 15 kHz (+19 dB, p < 0.001), 18 kHz (+17 dB, p = 0.002), 24 kHz (+21 dB, p < 0.001), and 30 kHz (+28 dB, p < 0.001) but not at 3 or 6 kHz compared with nonexposed mice. Threshold shifts did not significantly differ between +/+ and +/Cdh23v-mice at any of the frequencies tested (3, 9, 12, 15, 18, 24, and 30 kHz; p > 0.1). The shaded box marks the frequency of noise exposed to these mice. Error bars represent SEM.

Similar articles

Cited by

References

    1. Boeda B, El-Amraoui A, Bahloul A, Goodyear R, Daviet L, Blanchard S, Perfettini I, Fath KR, Shorte S, Reiners J, Houdusse A, Legrain P, Wolfrum U, Richardson G, Petit C. Myosin VIIa, harmonin and cadherin 23, three Usher I gene products that cooperate to shape the sensory hair cell bundle. EMBO J. 2002;21(24):6689–6699. doi: 10.1093/emboj/cdf689. - DOI - PMC - PubMed
    1. Bolz H, von Brederlow B, Ramirez A, Bryda EC, Kutsche K, Nothwang HG, Seeliger M, del C-Salcedo Cabrera M, Vila MC, Molina OP, Gal A, Kubisch C. Mutation of CDH23, encoding a new member of the cadherin gene family, causes Usher syndrome type 1D. Nat. Genet. 2001;27(1):108–112. doi: 10.1038/83667. - DOI - PubMed
    1. Bork JM, Peters LM, Riazuddin S, Bernstein SL, Ahmed ZM, Ness SL, Polomeno R, Ramesh A, Schloss M, Srisailpathy CR, Wayne S, Bellman S, Desmukh D, Ahmed Z, Khan SN, Kaloustian VM, Li XC, Lalwani A, Riazuddin S, Bitner–Glindzicz M, Nance WE, Liu XZ, Wistow G, Smith RJ, Griffith AJ, Wilcox ER, Friedman TB, Morell RJ. Usher syndrome 1D and nonsyndromic autosomal recessive deafness DFNB12 are caused by allelic mutations of the novel cadherin-like gene CDH23. AM. J. Hum. Genet. 2001;68(l):26–37. doi: 10.1086/316954. - DOI - PMC - PubMed
    1. Bryda EC, Kim HJ, Legare ME, Frankel WN, Noben–Trauth K. High-resolution genetic and physical mapping of modifier-of-deafwaddler (mdfw) and Waltzer (Cdh23v). Genomics. 2001;73(3):338–342. - PubMed
    1. Davis AC. The prevalence of hearing impairment and reported hearing disability among adults in Great Britain. Int. J. Epidemiol. 1989;8(4):911–917. - PubMed

Publication types

MeSH terms

LinkOut - more resources