. 2003 Dec;50(6):1248-55.
doi: 10.1002/mrm.10637.

Real-time volumetric flow measurements with complex-difference MRI

Affiliations

Real-time volumetric flow measurements with complex-difference MRI

Richard B Thompson et al. Magn Reson Med. 2003 Dec.

Abstract

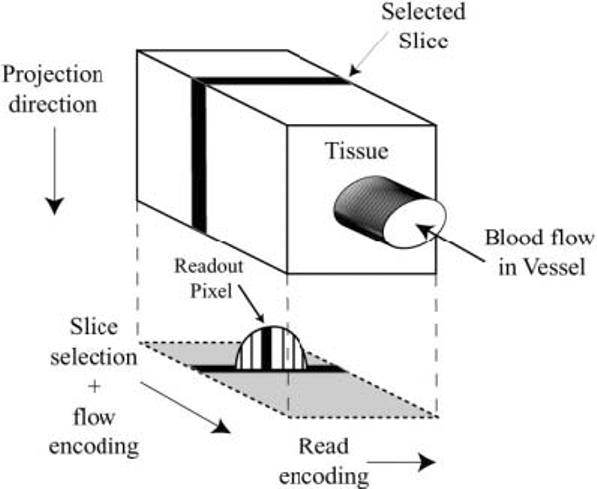
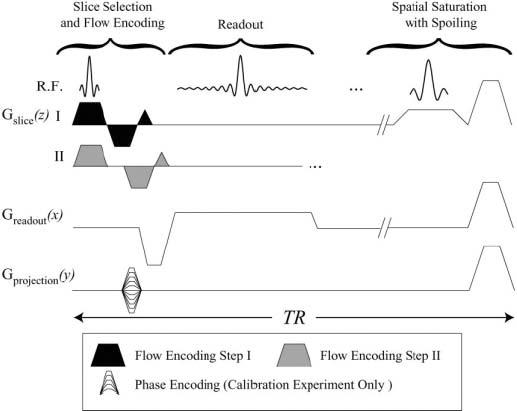
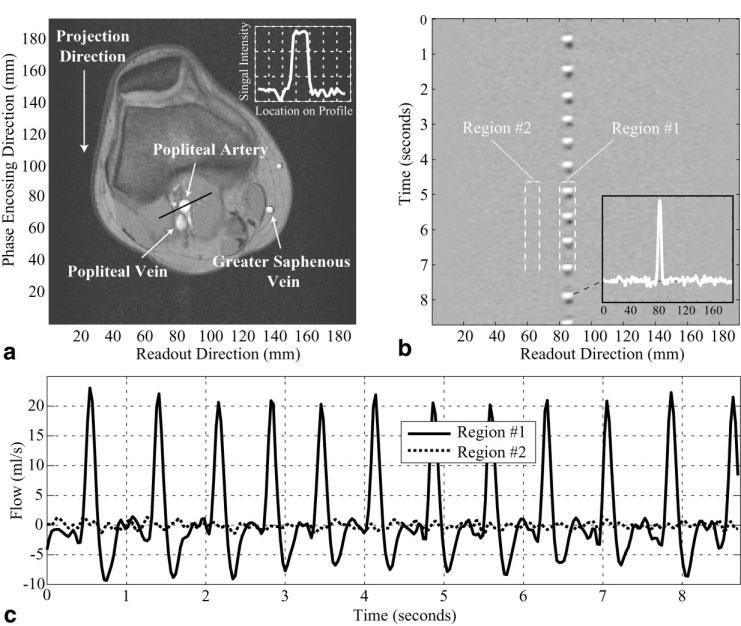
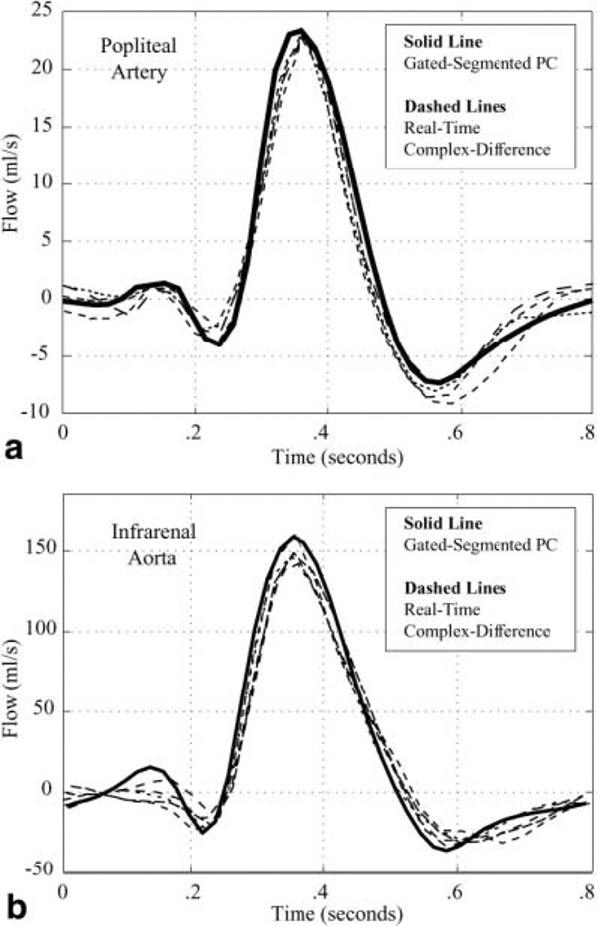
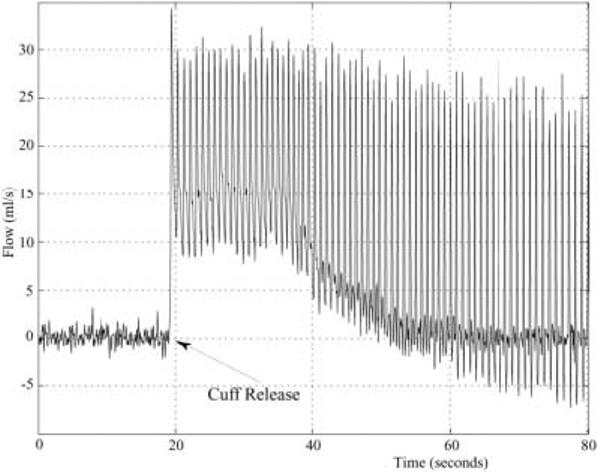
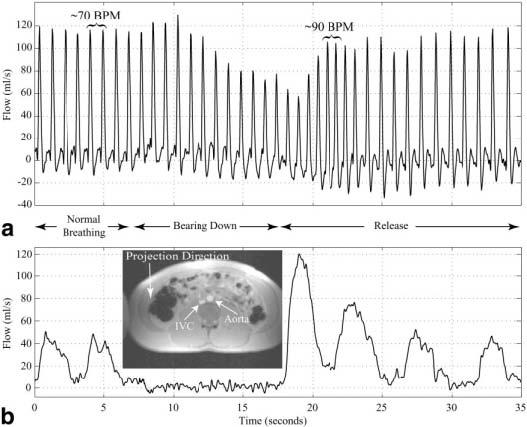
Blood flow in large vessels can be noninvasively evaluated with phase-contrast (PC) MRI by encoding the spin velocity to the image phase. Conventional phase-difference processing of the flow-encoded image data yields velocity images. Complex-difference processing is an alternative to phase-difference methods, and has the advantage of eliminating signal from stationary spins. In this study, two acquisitions with differential flow encoding are subtracted to yield a single projection that contains signal from only those spins moving in the direction of the flow-encoding gradients. The increase in acquisition efficiency allows real-time flow imaging with a temporal window as short as two acquisition lengths (60 ms). Validation of the complex-difference method by comparison with conventional gated-segmented PC-MRI in a flow phantom yielded a correlation of r > 0.99. Peak arterial flow rates in the popliteal artery and desending aorta measured in vivo with the complex-difference method were 0.92 +/- 0.06 of the values measured with conventional PC imaging. Real-time in vivo volumetric flow imaging of transient flow events is also presented.


Figures

FIG. 1
FIG. 1
A cartoon displays the read-encoding, slice/flow-encoding, and projection directions for the complex-difference flow imaging experiment. The projected signal is from the moving blood inside the vessel while signal from the tissue is subtracted out.
FIG. 2
FIG. 2
The real-time complex-difference pulse sequence. The two differential flow-encoding steps with first moments, ±M1z, labeled I and II, are interleaved in sequential excitations. An optional slab-selective saturation pulse can be played out every TR. The same pulse sequence elements, with the inclusion of phase-encoding gradients, are used for the collection of a calibration spin-density image.
FIG. 3
FIG. 3
a: A spin-density-weighted image at the level of the knee is used to measure the spin-density signal intensity in the popliteal artery. The inset shows a cross section of the spin-density signal intensity (scalibration) across the artery. A real-time series of complex-difference projections for the slice in a is shown in b, with a temporal resolution of 30 ms. Each horizontal line in b is the complex-difference signal intensity across the readout direction. c: The complex-difference signal intensity (from b) integrated across the artery in the readout direction, from 80 mm to 88 mm. The integrated signal intensity from a location next to the artery, from 60 mm to 68 mm, is also plotted in c. The signal intensity units are calibrated to milliliters per second using Eq. [9].
FIG. 4
FIG. 4
a: The blood flow rate in the popliteal artery of a normal volunteer is measured with conventional gated-segment PC-MRI (solid line). Several heartbeats of blood flow in the same artery are measured with the real-time complex-difference method (dashed lines) for a direct comparison of the two techniques. A single complete cardiac cycle is displayed. b: The blood flow rate in the infrarenal aorta of a normal volunteer is measured with conventional gated-segment PC-MRI (solid line). Several heartbeats of blood flow in the same artery are measured with the real-time complex-difference method (dashed lines) for a direct comparison of the two techniques. A single complete cardiac cycle is displayed.
FIG. 5
FIG. 5
Blood flow in the popliteal artery of a normal volunteer is measured with the real-time complex-difference method during the release of an occlusive thigh cuff. The thigh cuff was inflated to supersystolic pressures (220 mmHg) for 5 min to induce reactive hyperemia.
FIG. 6
FIG. 6
a: Blood flow in the infrarenal aorta of a normal volunteer is measured throughout a Valsalva maneuver, starting with normal breathing and during the time of forced expiration (bearing down). The timing of the paradigm is shown between the figures. b: The blood flow in the inferior vena cava is measured simultaneously with the aortic flow shown in a. The inset in b shows the spin-density image collected prior to the Valsalva experiment.

References

    1. Nayler GL, Firmin DN, Longmore DB. Blood flow imaging by cine magnetic resonance. J Comput Assist Tomogr. 1986;10:715–722. - PubMed
    1. Pelc NJ, Herfkens RJ, Shimakawa A, Enzmann DR. Phase contrast cine magnetic resonance imaging. Magn Reson Q. 1991;7:229–254. - PubMed
    1. Meuli RA, Wedeen VJ, Geller SC, Edelman RR, Frank LR, Brady TJ, Rosen BR. MR gated subtraction angiography: evaluation of lower extremities. Radiology. 1986;159:411–418. - PubMed
    1. Dumoulin CL, Hart HR., Jr Magnetic resonance angiography. Radiology. 1986;161:717–720. - PubMed
    1. Wedeen VJ, Rosen BR, Buxton R, Brady TJ. Projective MRI angiography and quantitative flow-volume densitometry. Magn Reson Med. 1986;3:226–241. - PubMed