

Delivering equitable care: comparing preventive services in Manitoba
- PMID: 14652339
- PMCID: PMC1448157
- DOI: 10.2105/ajph.93.12.2086
Delivering equitable care: comparing preventive services in Manitoba
Abstract
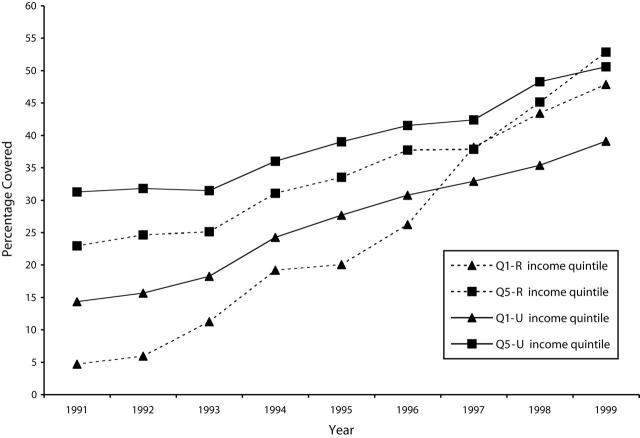
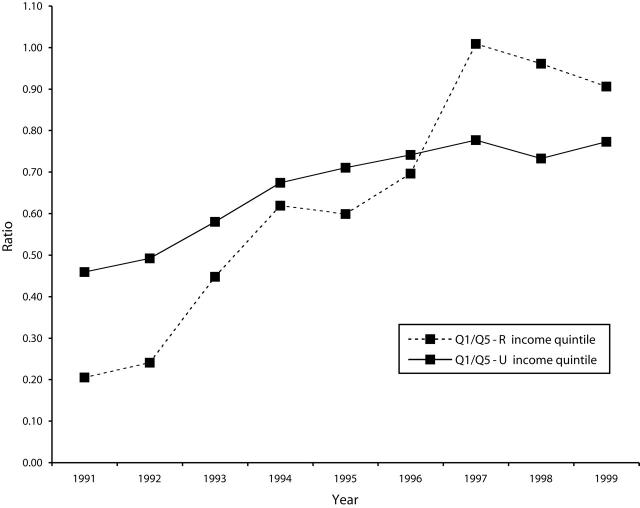
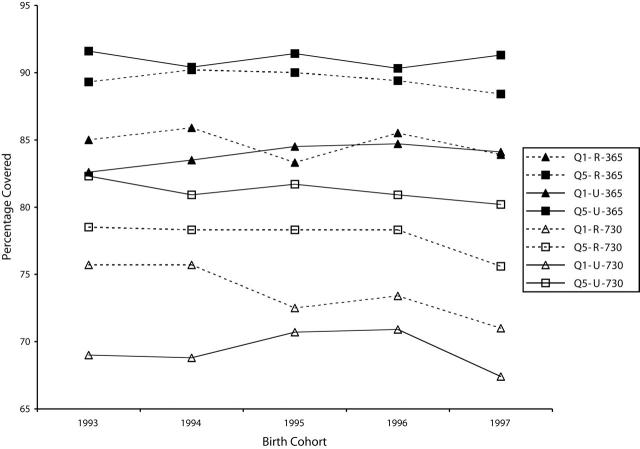
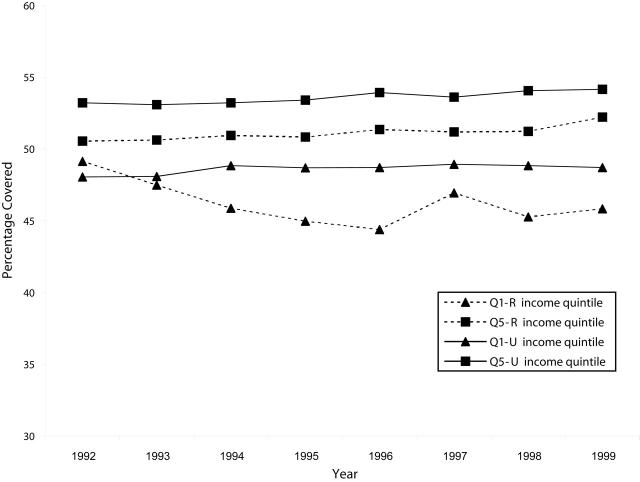
Objectives: This study examined preventive care delivered in Manitoba during the 1990s by 3 different methods -childhood immunizations (by physicians and public health nurses under a government program), screening mammography (through a government program introduced in 1995), and cervical cancer screening (no program).
Methods: Longitudinal administrative data, an immunization monitoring system, and Canadian census databases were used.
Results: Cervical cancer screening rates remained static and showed strong socioeconomic differences; childhood immunization rates remained high with small socioeconomic gradients. The introduction of the Manitoba Breast Screening Program resulted in rising rates of screening and vanishing socioeconomic gradients.
Conclusions: Manitoba government programs in childhood immunization and screening mammography actively helped the provision of preventive care. Organized programs that target population groups, recognize barriers to access, and facilitate self-evaluation are critical for equitable delivery.
Figures
References
-
- Katz SJ, Hofer TP. Socioeconomic disparities in preventive care persist despite universal coverage: breast and cervical cancer screening in Ontario and the United Kingdom. JAMA. 1994;272:530–534. - PubMed
-
- Gorey KM, Holowaty EJ, Laukkanen E, Fehringer G, Richter NL. Association between socioeconomic status and cancer incidence in Toronto, Ontario: possible confounding of cancer mortality by incidence and survival. Cancer Prev Control. 1998;2:236–241. - PubMed
-
- Billings J, Zeitel L, Lukomnik J, Carey TS, Blank AE, Newman L. Datawatch: impact of socioeconomic status on hospital use in New York City. Health Aff (Millwood). 1993;12:162–173. - PubMed
-
- Lantz PM, Weigers ME, House JS. Education and income differentials in breast and cervical cancer screening: policy implications for rural women. Med Care. 1997;35:219–236. - PubMed
Publication types
MeSH terms
LinkOut - more resources
Full Text Sources
Medical
