Comparative Study
. 2003 Dec;13(12):2507-18.
doi: 10.1101/gr.1602203.

Identification and characterization of multi-species conserved sequences

Affiliations
Comparative Study

Identification and characterization of multi-species conserved sequences

Elliott H Margulies et al. Genome Res. 2003 Dec.

Abstract

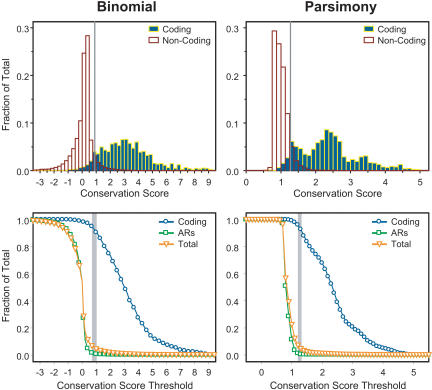
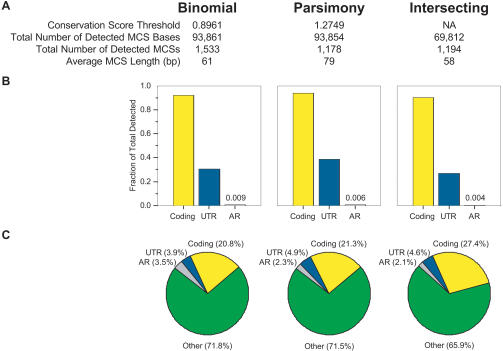
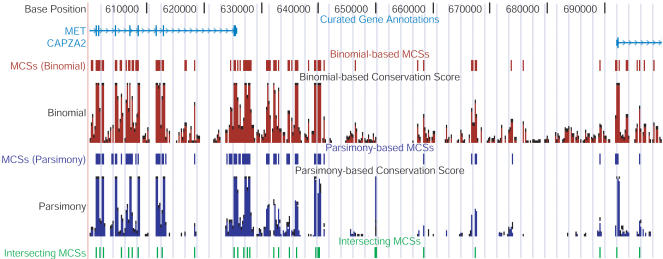
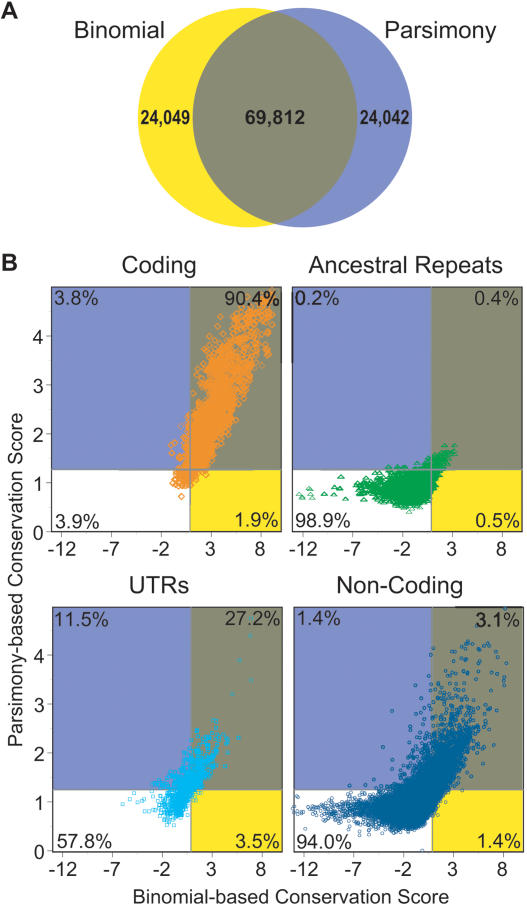
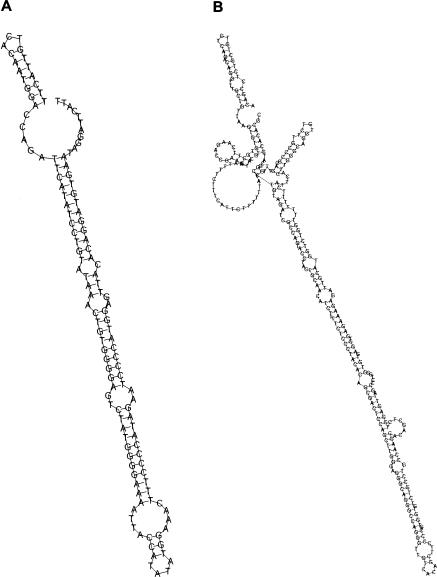
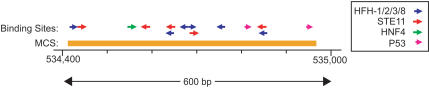
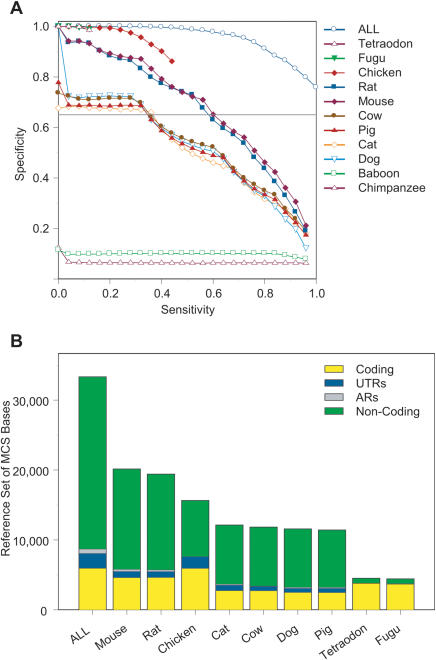
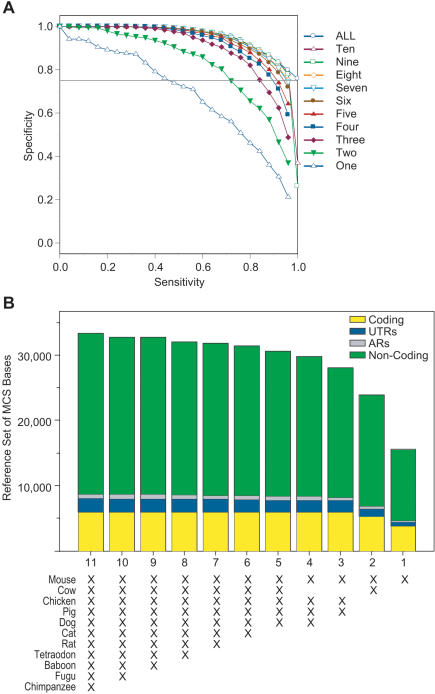
Comparative sequence analysis has become an essential component of studies aiming to elucidate genome function. The increasing availability of genomic sequences from multiple vertebrates is creating the need for computational methods that can detect highly conserved regions in a robust fashion. Towards that end, we are developing approaches for identifying sequences that are conserved across multiple species; we call these "Multi-species Conserved Sequences" (or MCSs). Here we report two strategies for MCS identification, demonstrating their ability to detect virtually all known actively conserved sequences (specifically, coding sequences) but very little neutrally evolving sequence (specifically, ancestral repeats). Importantly, we find that a substantial fraction of the bases within MCSs (approximately 70%) resides within non-coding regions; thus, the majority of sequences conserved across multiple vertebrate species has no known function. Initial characterization of these MCSs has revealed sequences that correspond to clusters of transcription factor-binding sites, non-coding RNA transcripts, and other candidate functional elements. Finally, the ability to detect MCSs represents a valuable metric for assessing the relative contribution of a species' sequence to identifying genomic regions of interest, and our results indicate that the currently available genome sequences are insufficient for the comprehensive identification of MCSs in the human genome.


Figures

Figure 1
Figure 1
Discrimination of different types of sequence using conservation scores calculated by the binomial- (left) and parsimony- (right) based methods. The top two histograms depict the distribution of conservation scores calculated for coding (blue outlined in yellow) and non-coding (white outlined in red) sequence by each method. Note that the distributions are represented as a fraction of the total sequence in each annotated category and that only 1.1% of the sequence in the analyzed region represents coding sequence. The vertical lines indicate the conservation score thresholds used for defining MCSs (see text). The bottom two graphs show the detection of different types of sequence at increasing conservation score thresholds. The fraction of sequence in each annotated category (coding, ARs, and total) that exceeded the indicated conservation score threshold is plotted. The vertical bars (shaded in grey) reflect the small range of conservation score thresholds that optimally results in the detection of nearly all coding sequence along with a minimum amount of the total sequence (4% to 7%).
Figure 2
Figure 2
Characteristics of MCSs detected by different methods. The “Binomial” and “Parsimony” columns provide a summary of the MCSs generated by each respective method. The “Intersecting” column provides a summary of the MCSs derived by intersecting the results of the binomial- and parsimony-based methods (see Methods and Fig. 4). The general features of the detected MCSs are provided in A. The thresholds used for the binomial- and parsimony-based methods result in a virtually identical number of MCS bases; however, the total number of detected MCSs (and correspondingly their average length) varied between the two methods. Also, the greater number of intersecting MCSs compared to those detected by the parsimony-based method reflects the fact that some MCSs were fragmented by the intersection process. The bar graphs in B depict the fraction of coding, UTR, and AR bases in the target region that overlaps the indicated set of MCSs. For the fraction of AR bases, the exact values are also provided. The pie charts in C depict the percentage of MCS bases that corresponds to coding (yellow), UTR (blue), AR (grey), and other (green) sequence.
Figure 3
Figure 3
Positions of MCSs relative to other annotated genomic features. A complete representation of the positions of MCSs within the ∼1.8-Mb targeted region is available at a customized version of the UCSC Genome Browser (see http://genome.ucsc.edu). A view depicting a ∼100-kb interval encompassing the intergenic region between MET and CAPZA2 is shown. The thick vertical boxes in the “Curated Gene Annotations” track correspond to exons. The positions of MCSs identified by the binomial- (red) and parsimony- (purple) based methods are shown in separate tracks, as are the underlying conservation scores calculated by each method (depicted as bar graphs). Also shown are the positions of the intersecting set of MCSs (green; see text and Fig. 2).
Figure 4
Figure 4
Concordance of the binomial- and parsimony-based methods for MCS detection. (A) Venn diagram showing the relationship of MCS bases detected by the binomial- (yellow circle) and parsimony- (purple circle) based methods, with the bases detected by both methods shown in brown. Also indicated is the total number of MCS bases in each category. (B) Scatter plots showing the relationship of the conservation scores calculated by each method for bases residing in different types of sequence. Each point represents a base that falls within coding sequence (orange), ARs (green), UTRs (light blue), or non-coding sequence (dark blue), with its position on the x- and y-axes reflecting the conservation score calculated by the binomial- and parsimony-based methods, respectively. The boundaries of each rectangular area (color coded to match the Venn diagram in A) correspond to the established conservation score threshold for each method (see Figs. 1, 2). The indicated percentages reflect the fraction of bases of the indicated type of sequence falling within that area. For visual clarity, every tenth base is plotted; however, the indicated percentages reflect all bases.
Figure 5
Figure 5
Representative RNA secondary structures predicted for sequences within two MCSs. The minimal free energy structures for the human sequences are depicted, as produced by the Vienna Package (Hofacker et al. 1994). (A) Hairpin structure within an MCS in intron 1 of ST7 (log-odds = 26.3, position of sequence displayed: 855569–855698). (B) Hairpin structure within an MCS in intron 11 of ST7 (log-odds = 46.7, position of sequence displayed: 1019625–1019879).
Figure 6
Figure 6
A 600-bp region within MET intron 2 with clustered putative binding sites for the indicated transcription factors. The orange bar depicts the position of a detected MCS; note that this MCS is flanked by 4.6 kb and 26 kb of intronic sequence, respectively. Two of the binding sites for HFH (hepatocyte nuclear factor homolog) transcription factors overlap, and there are thus only six independent occurrences.
Figure 7
Figure 7
Ability of individual species' sequences to detect MCSs. (A) Using the indicated species' sequences, MCSs were identified by the binomial-based method over a range of conservation score thresholds. Shown is the resulting relationship between sensitivity (fraction of reference MCS bases detected; see Methods) and specificity (fraction of detected MCS bases that corresponds to reference MCS bases). Also indicated are the results using the sequences from all 11 non-human species (ALL). Note that the limited amount of alignable sequence from chicken and fish impedes the ability to obtain the full range of sensitivity/specificity values. (B) Detection of reference MCS bases, indicated for each type of sequence (coding, UTRs, ARs, and non-coding). This is shown for each species' sequence using the data obtained with a specificity of 65% (horizontal grey line in A), except for chicken and fish. For the latter species, data obtained with specificities of 81% and 99%, respectively, were used (since lower specificities cannot be achieved with these sequences; see A). ALL represents the entire set of reference MCS bases (which is detected by the binomial-based method with a 75% specificity when the sequences from all 11 non-human species are used). Data with non-human primate sequences were not included in B because of their inability to achieve a specificity of 65% (see A). Note that a specificity of 65% was chosen since it allowed the inclusion of most species' sequences. The underlying data associated with these analyses are available at http://www.nisc.nih.gov/data.
Figure 8
Figure 8
Ability of combinations of different species' sequences to detect MCSs. Sequences from every combination of the 11 non-human species were analyzed by the binomial-based method, and the subset of each possible number of species (from 1 to 10, in addition to human) yielding the highest sensitivity at 75% specificity was identified. Note that the ranking of the subsets remains essentially the same for a wide range of specificity thresholds. (A) The resulting relationship between sensitivity and specificity is shown for each subset (see Fig. 7A for details). (B) Detection of reference MCS bases (see Fig. 7B for details), shown for each best-performing subset of species using data obtained with a specificity of 75% (horizontal grey line in A). Note that the far-left bar represents the entire set of reference MCS bases (see Fig. 7B). The underlying data associated with these analyses are available at http://www.nisc.nih.gov/data.

Similar articles

Cited by

  • Hippo-Yap Signaling Maintains Sinoatrial Node Homeostasis.
    Zheng M, Li RG, Song J, Zhao X, Tang L, Erhardt S, Chen W, Nguyen BH, Li X, Li M, Wang J, Evans SM, Christoffels VM, Li N, Wang J. Zheng M, et al. Circulation. 2022 Nov 29;146(22):1694-1711. doi: 10.1161/CIRCULATIONAHA.121.058777. Epub 2022 Nov 1. Circulation. 2022. PMID: 36317529 Free PMC article.
  • Analyses of deep mammalian sequence alignments and constraint predictions for 1% of the human genome.
    Margulies EH, Cooper GM, Asimenos G, Thomas DJ, Dewey CN, Siepel A, Birney E, Keefe D, Schwartz AS, Hou M, Taylor J, Nikolaev S, Montoya-Burgos JI, Löytynoja A, Whelan S, Pardi F, Massingham T, Brown JB, Bickel P, Holmes I, Mullikin JC, Ureta-Vidal A, Paten B, Stone EA, Rosenbloom KR, Kent WJ, Bouffard GG, Guan X, Hansen NF, Idol JR, Maduro VV, Maskeri B, McDowell JC, Park M, Thomas PJ, Young AC, Blakesley RW, Muzny DM, Sodergren E, Wheeler DA, Worley KC, Jiang H, Weinstock GM, Gibbs RA, Graves T, Fulton R, Mardis ER, Wilson RK, Clamp M, Cuff J, Gnerre S, Jaffe DB, Chang JL, Lindblad-Toh K, Lander ES, Hinrichs A, Trumbower H, Clawson H, Zweig A, Kuhn RM, Barber G, Harte R, Karolchik D, Field MA, Moore RA, Matthewson CA, Schein JE, Marra MA, Antonarakis SE, Batzoglou S, Goldman N, Hardison R, Haussler D, Miller W, Pachter L, Green ED, Sidow A. Margulies EH, et al. Genome Res. 2007 Jun;17(6):760-74. doi: 10.1101/gr.6034307. Genome Res. 2007. PMID: 17567995 Free PMC article.
  • Addition of the microchromosome GGA25 to the chicken genome sequence assembly through radiation hybrid and genetic mapping.
    Douaud M, Fève K, Gerus M, Fillon V, Bardes S, Gourichon D, Dawson DA, Hanotte O, Burke T, Vignoles F, Morisson M, Tixier-Boichard M, Vignal A, Pitel F. Douaud M, et al. BMC Genomics. 2008 Mar 17;9:129. doi: 10.1186/1471-2164-9-129. BMC Genomics. 2008. PMID: 18366813 Free PMC article.
  • Human IRES Atlas: an integrative platform for studying IRES-driven translational regulation in humans.
    Yang TH, Wang CY, Tsai HC, Liu CT. Yang TH, et al. Database (Oxford). 2021 May 3;2021:baab025. doi: 10.1093/database/baab025. Database (Oxford). 2021. PMID: 33942874 Free PMC article.
  • In silico and functional studies of the regulation of the glucocerebrosidase gene.
    Blech-Hermoni YN, Ziegler SG, Hruska KS, Stubblefield BK, Lamarca ME, Portnoy ME; NISC Comparative Sequencing Program; Green ED, Sidransky E. Blech-Hermoni YN, et al. Mol Genet Metab. 2010 Mar;99(3):275-82. doi: 10.1016/j.ymgme.2009.10.189. Epub 2009 Nov 4. Mol Genet Metab. 2010. PMID: 20004604 Free PMC article.

References

    1. Akker, S.A., Smith, P.J., and Chew, S.L. 2001. Nuclear post-transcriptional control of gene expression. J. Mol. Endocrinol. 27: 123-131. - PubMed
    1. Alexandersson, M., Cawley, S., and Pachter, L. 2003. SLAM: Cross-species gene finding and alignment with a generalized pair hidden Markov model. Genome Res. 13: 496-502. - PMC - PubMed
    1. Altschul, S.F., Gish, W., Miller, W., Myers, E.W., and Lipman, D.J. 1990. Basic local alignment search tool. J. Mol. Biol. 215: 403-410. - PubMed
    1. Aparicio, S., Chapman, J., Stupka, E., Putnam, N., Chia, J.M., Dehal, P., Christoffels, A., Rash, S., Hoon, S., Smit, A., et al. 2002. Whole-genome shotgun assembly and analysis of the genome of Fugu rubripes. Science 297: 1301-1310. - PubMed
    1. Bailey, L. and Elkan, C. 1995. Unsupervised learning of multiple motifs in biopolymers using expectation maximization. Machine Learning 21: 51-80.

WEB SITE REFERENCES

    1. http://www.nisc.nih.gov; NIH Intramural Sequencing Center (NISC) home page.
    1. http://www.nisc.nih.gov/data; Supplementary data, including annotated sequence for the studies reported here and supplemental tables.
    1. http://genome.ucsc.edu; UC Santa Cruz Genome Browser home page, including the multi-species “zoo browser.”
    1. http://bio.cs.washington.edu; Computational Molecular Biology Group (University of Washington, Computer Science & Engineering) home page.
    1. http://genome.gov/ENCODE; ENCODE project home page.

Publication types

Substances

LinkOut - more resources